The latest list of Zooniverse projects in languages other than English is in.
As always, thank you to Zooniverse volunteer Sallyann Chesson for preparing this updated list of translated projects, and to all our volunteer project translators for their ongoing contributions.
Please note that we will no longer be posting these lists, as the Zooniverse’s updated Project Page now allows you to filter projects by language. You can read more about the new interface here.
Do you want to become a Zooniverse translator? Are you a research team member looking to translate your project? Here is what you need to know.
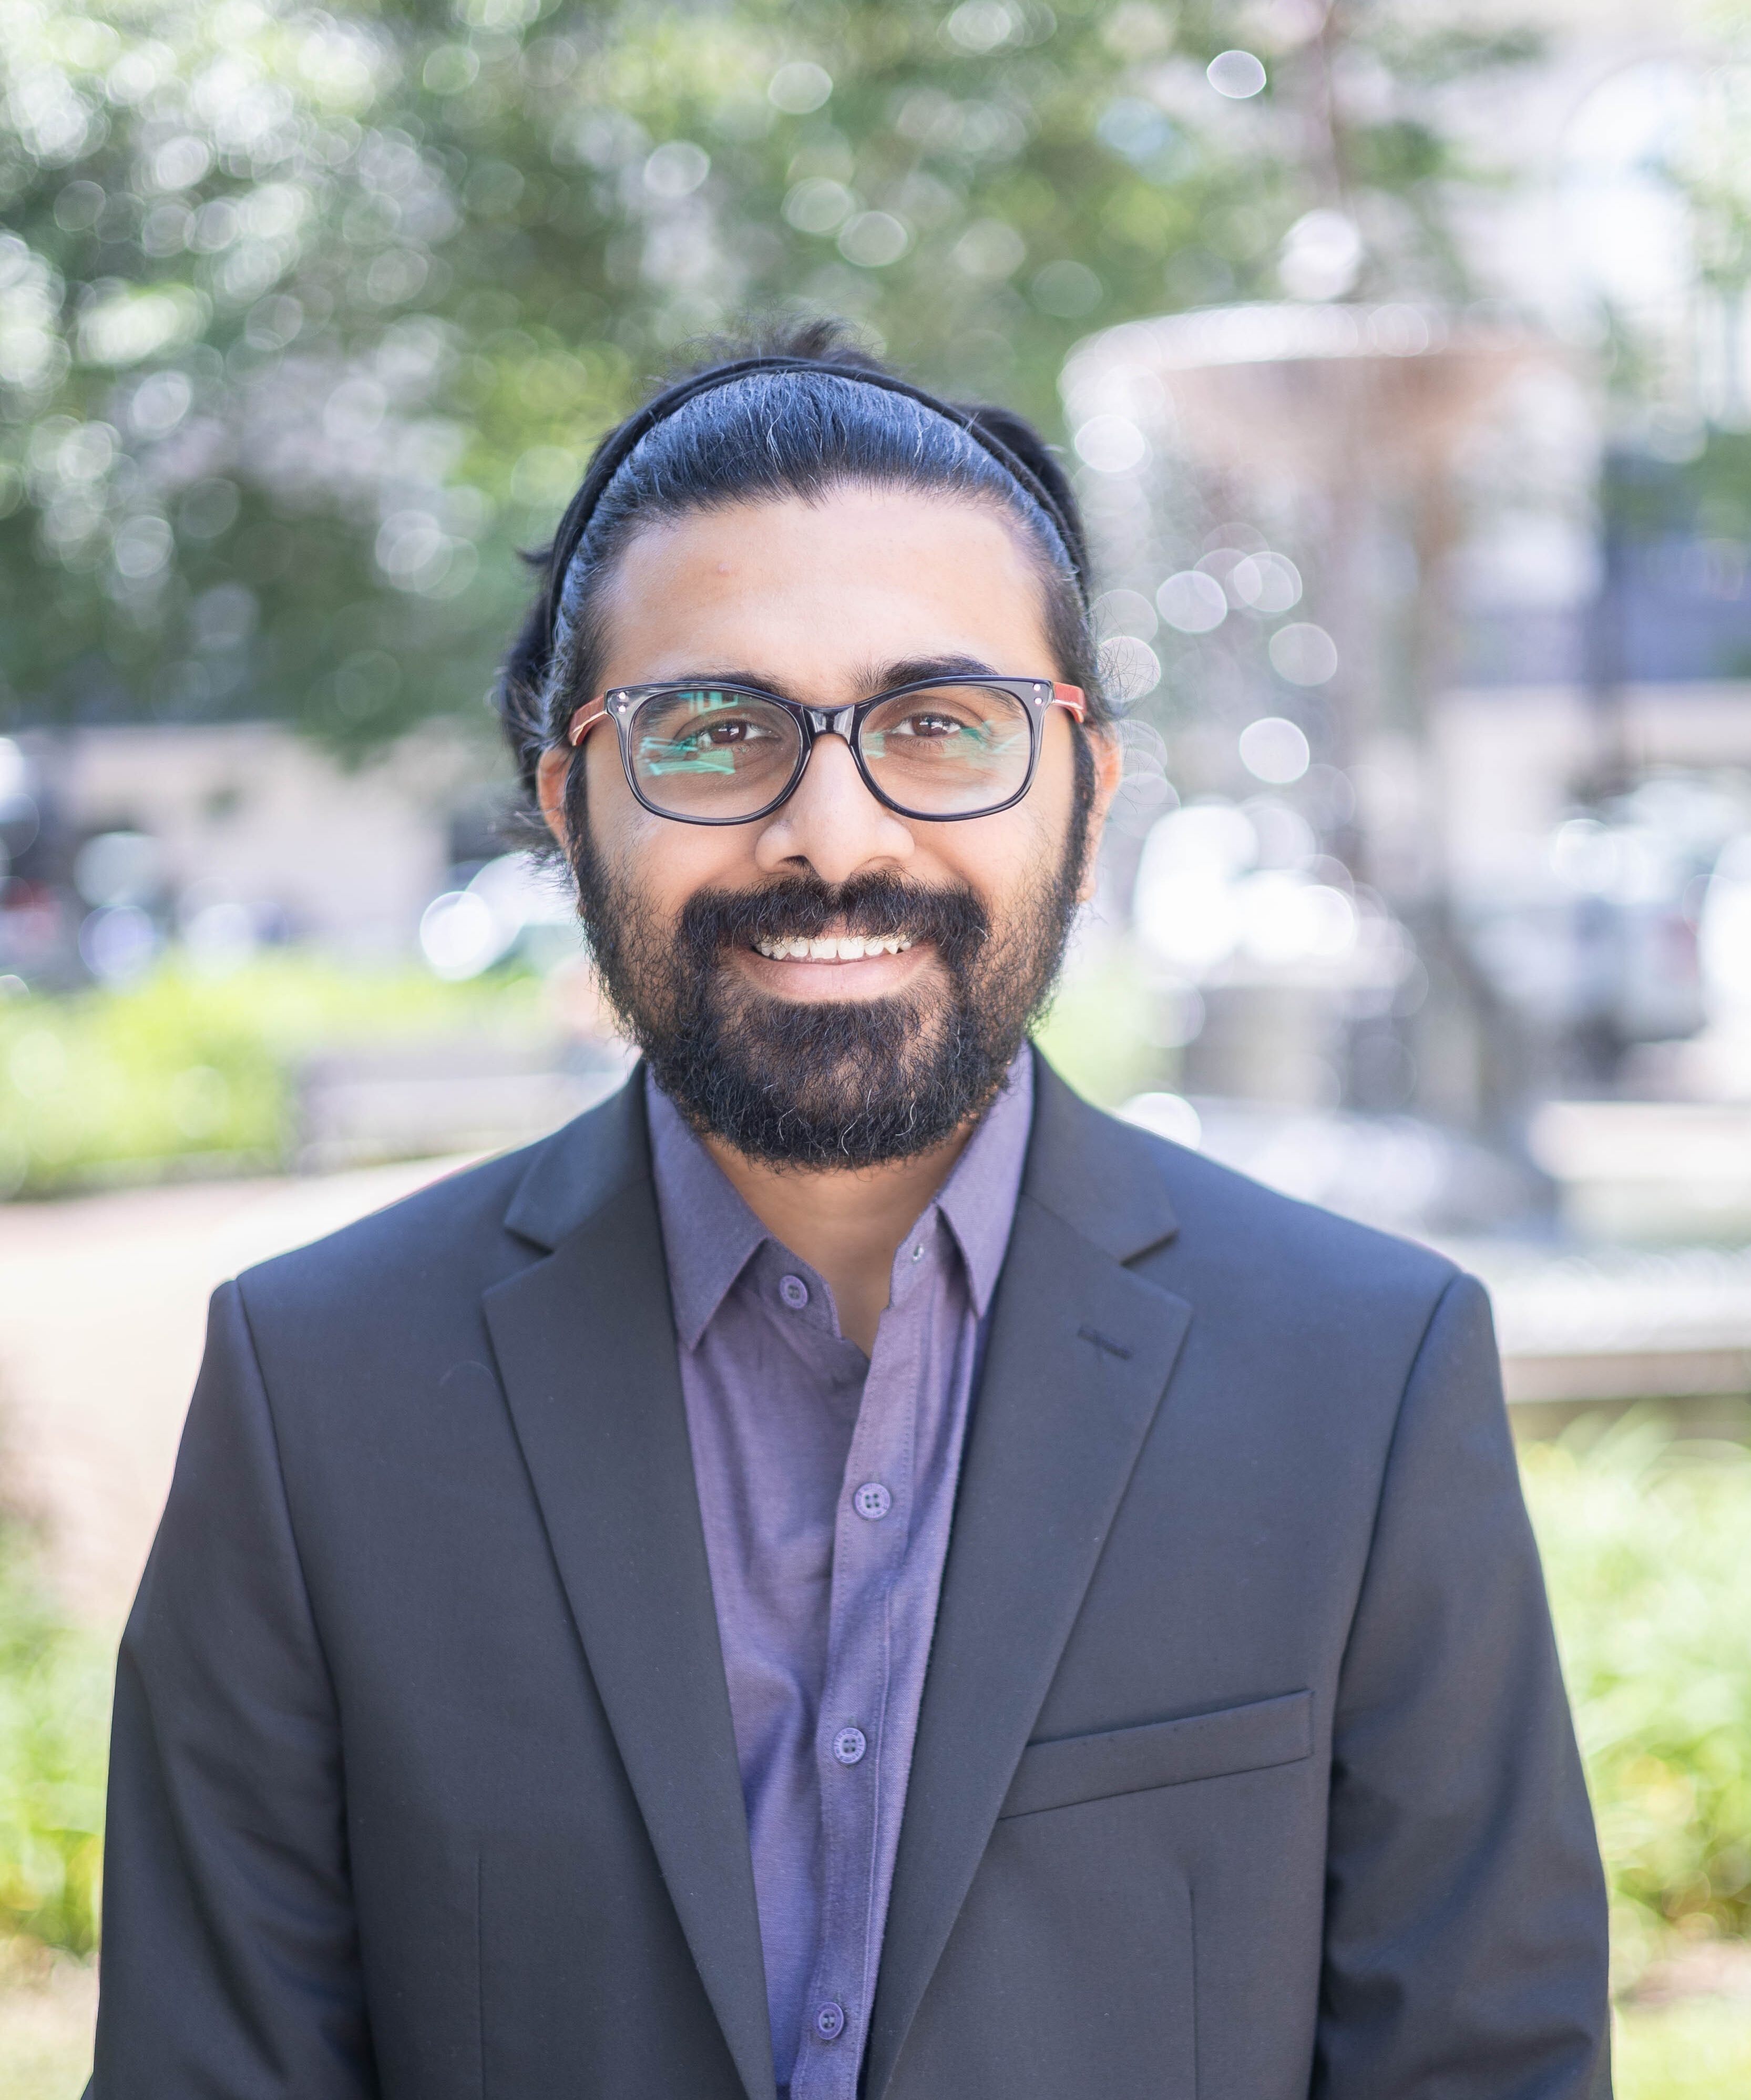
Name: Kameswara Bharadwaj Mantha (Senior AI/ML Research Scientist)
Location: University of Missouri-Kansas City
Zooniverse projects: Galaxy Zoo, Galaxy Zoo: Weird & Wonderful, Galaxy Zoo: Clump Scout, Cosmic Disco, MindMapper, many more probably 🙂
What is your research about?
My research is broadly about using AI, machine learning, and human-guided data analysis to make sense of large and complex scientific datasets across multiple fields. I have worked in areas ranging from astronomy and imaging-based science to biomedical and health-related research, and what connects all of these spaces is the same core challenge: we now generate far more data than any one person can carefully analyze alone. My work focuses on building ways for computational tools and human insight to work together so that we can identify meaningful patterns, unusual cases, and scientifically important signals more effectively.
What excites me especially is that this idea translates naturally across disciplines. In one setting, it might involve helping classify or discover unusual structures in astronomical data, whereas in another, it might involve biomedical images, disease-related patterns, or genetic data that can inform better diagnostics or drug discovery. I am particularly enthusiastic about the biomedical side of this work because of its direct potential to improve how we understand disease and develop better treatments. For me, projects like these are exciting because they sit at the intersection of discovery, data, and impact. Such work allows us to use large-scale human participation and AI not only to handle complex datasets, but also to ask better scientific questions and discover previously unknown landscapes.
How do Zooniverse volunteers contribute to your research?
Zooniverse volunteers play a central role in my research because they help generate the kind of high-quality human insight that large scientific datasets often still need. In many of the problems I work on, whether in astronomy or other data-rich areas, there is simply too much information for a small research team to inspect carefully by hand. Volunteers help by identifying key patterns, classifying structures, flagging unusual cases, and, importantly, surfacing examples that may not fit neatly into existing categories. That is especially exciting to me because those “hard-to-describe” or unexpected cases are often where new science begins. Rather than thinking of volunteers as just helping label data, I see them as active contributors to discovery and to the design of better collaborative human-AI systems.
What makes Zooniverse particularly important in my work is that I am interested not only in the final scientific answer, but also in how humans and machines can learn from each other. Volunteers can help us build more reliable training datasets, evaluate where machine-learning models succeed or fail, and identify “unknown unknowns” that are cases where automated systems might miss because they fall outside the patterns the model has already learned. That question has been central to some of my published work, including research on how citizen science and machine learning can be combined for more effective identification of unknown or unusual structures in big data.
Through Zooniverse, I hope to answer both scientific and methodological questions. On the scientific side, the goal is to better characterize complex structures and rare phenomena in large datasets. On the methodological side, I want to understand how to efficiently use volunteer’s time with machine learning, how disagreement or uncertainty in classifications can itself become scientifically meaningful, and how citizen science can be used for genuine discovery. That broader theme runs across my work in Zooniverse-related collaborations, including citizen-science projects connected to galaxy morphology, unusual object identification, and human-in-the-loop AI systems.
What’s a surprising or fun fact about your research field?
A weird and wonderful part (pun intended!) of the domains I work in is that sometimes the most valuable data points are the ones that do not belong. We spend a lot of time building systems to classify things and putting them in pre-determined buckets. However, the discoveries often emerge out of the outliers: the object that looks wrong, the signal that breaks expectations, or the pattern no one thought to search for. In that sense, “mistakes,” surprises, and oddballs can end up being the most scientifically useful part of the dataset. I believe this notion transcends beyond astronomy into any domain; In fact this same philosophy led me down a path of scientific discovery in the core biomedical domain!
Kameswara Bharadwaj Mantha (Senior AI/ML Research Scientist)
What first got you interested in research?
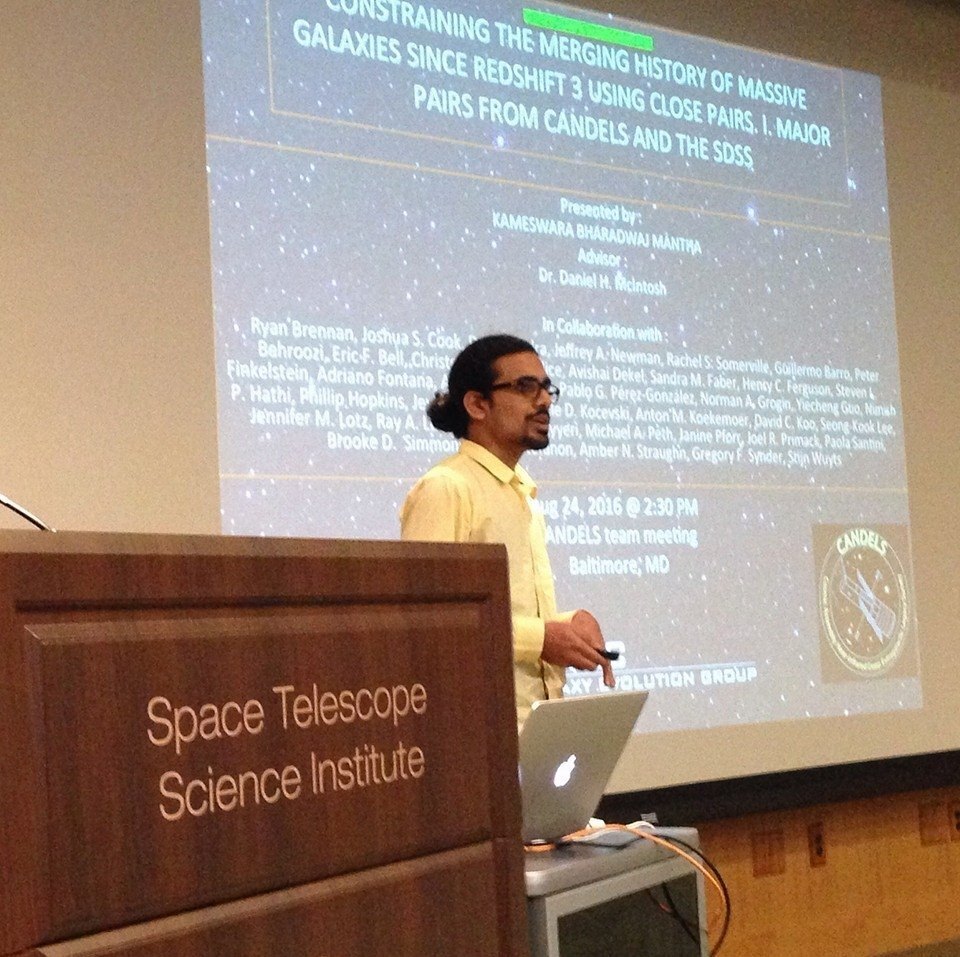
First, I wanted to become a medical doctor. Human body and its function fascinates me to this day. I carry with me a tinge of obsession for learning something new. As life took be down a different path, into pursuing engineering, I have been finding my way back into doing what I want for over a decade or so. That’s when I decided to pursue my graduate school in more fundamental science domains, such as Physics, and eventually in Astrophysics. My first research experience was in studying galaxies and their evolution. Astronomy made me realize the true breadth of knowledge and my place in the universe. It unlocked a new avenue in my learning and scientific research capabilities and I eagerly applied it to learning and contributing to biomedicine.
What’s something people might not expect about your job or daily routine?
My expertise and daily job related duties lies at the junction of Astrophysics, applied Artificial Intelligence & Machine Learning, and core biomedical clinical research. One potentially unexpected item that may come as a surprise is, how many times and how fast I have to switch gears from talking about distant galaxies, to microscopic cellular level genes, to aerospace optimizations, and to cybersecurity, often in back-to-back settings 🙂 … I love it though!
Outside of work, what do you enjoy doing?
Reading and collecting medical textbooks, listening to medical talks/test prep videos, hosting and creating podcasts, playing chess, planning road trips, cooking and experimenting with cuisine fusions, having philosophical discussions … and generally learning new things 🙂
What are your favourite citizen science projects?
Etch A Cell; Infection Inspection; Eyes on Eyes; Genome Detectives;
What guidance would you give to other researchers considering creating a citizen research project?
It is really important to double/triple check if the task is broken down into the the most intuitive and low cognitive burden way. Volunteers appreciate tasks that are to the point and can contribute meaningfully to the overall research goal. Next, communication with the volunteers is really important! Talk to your volunteers and engage with them!
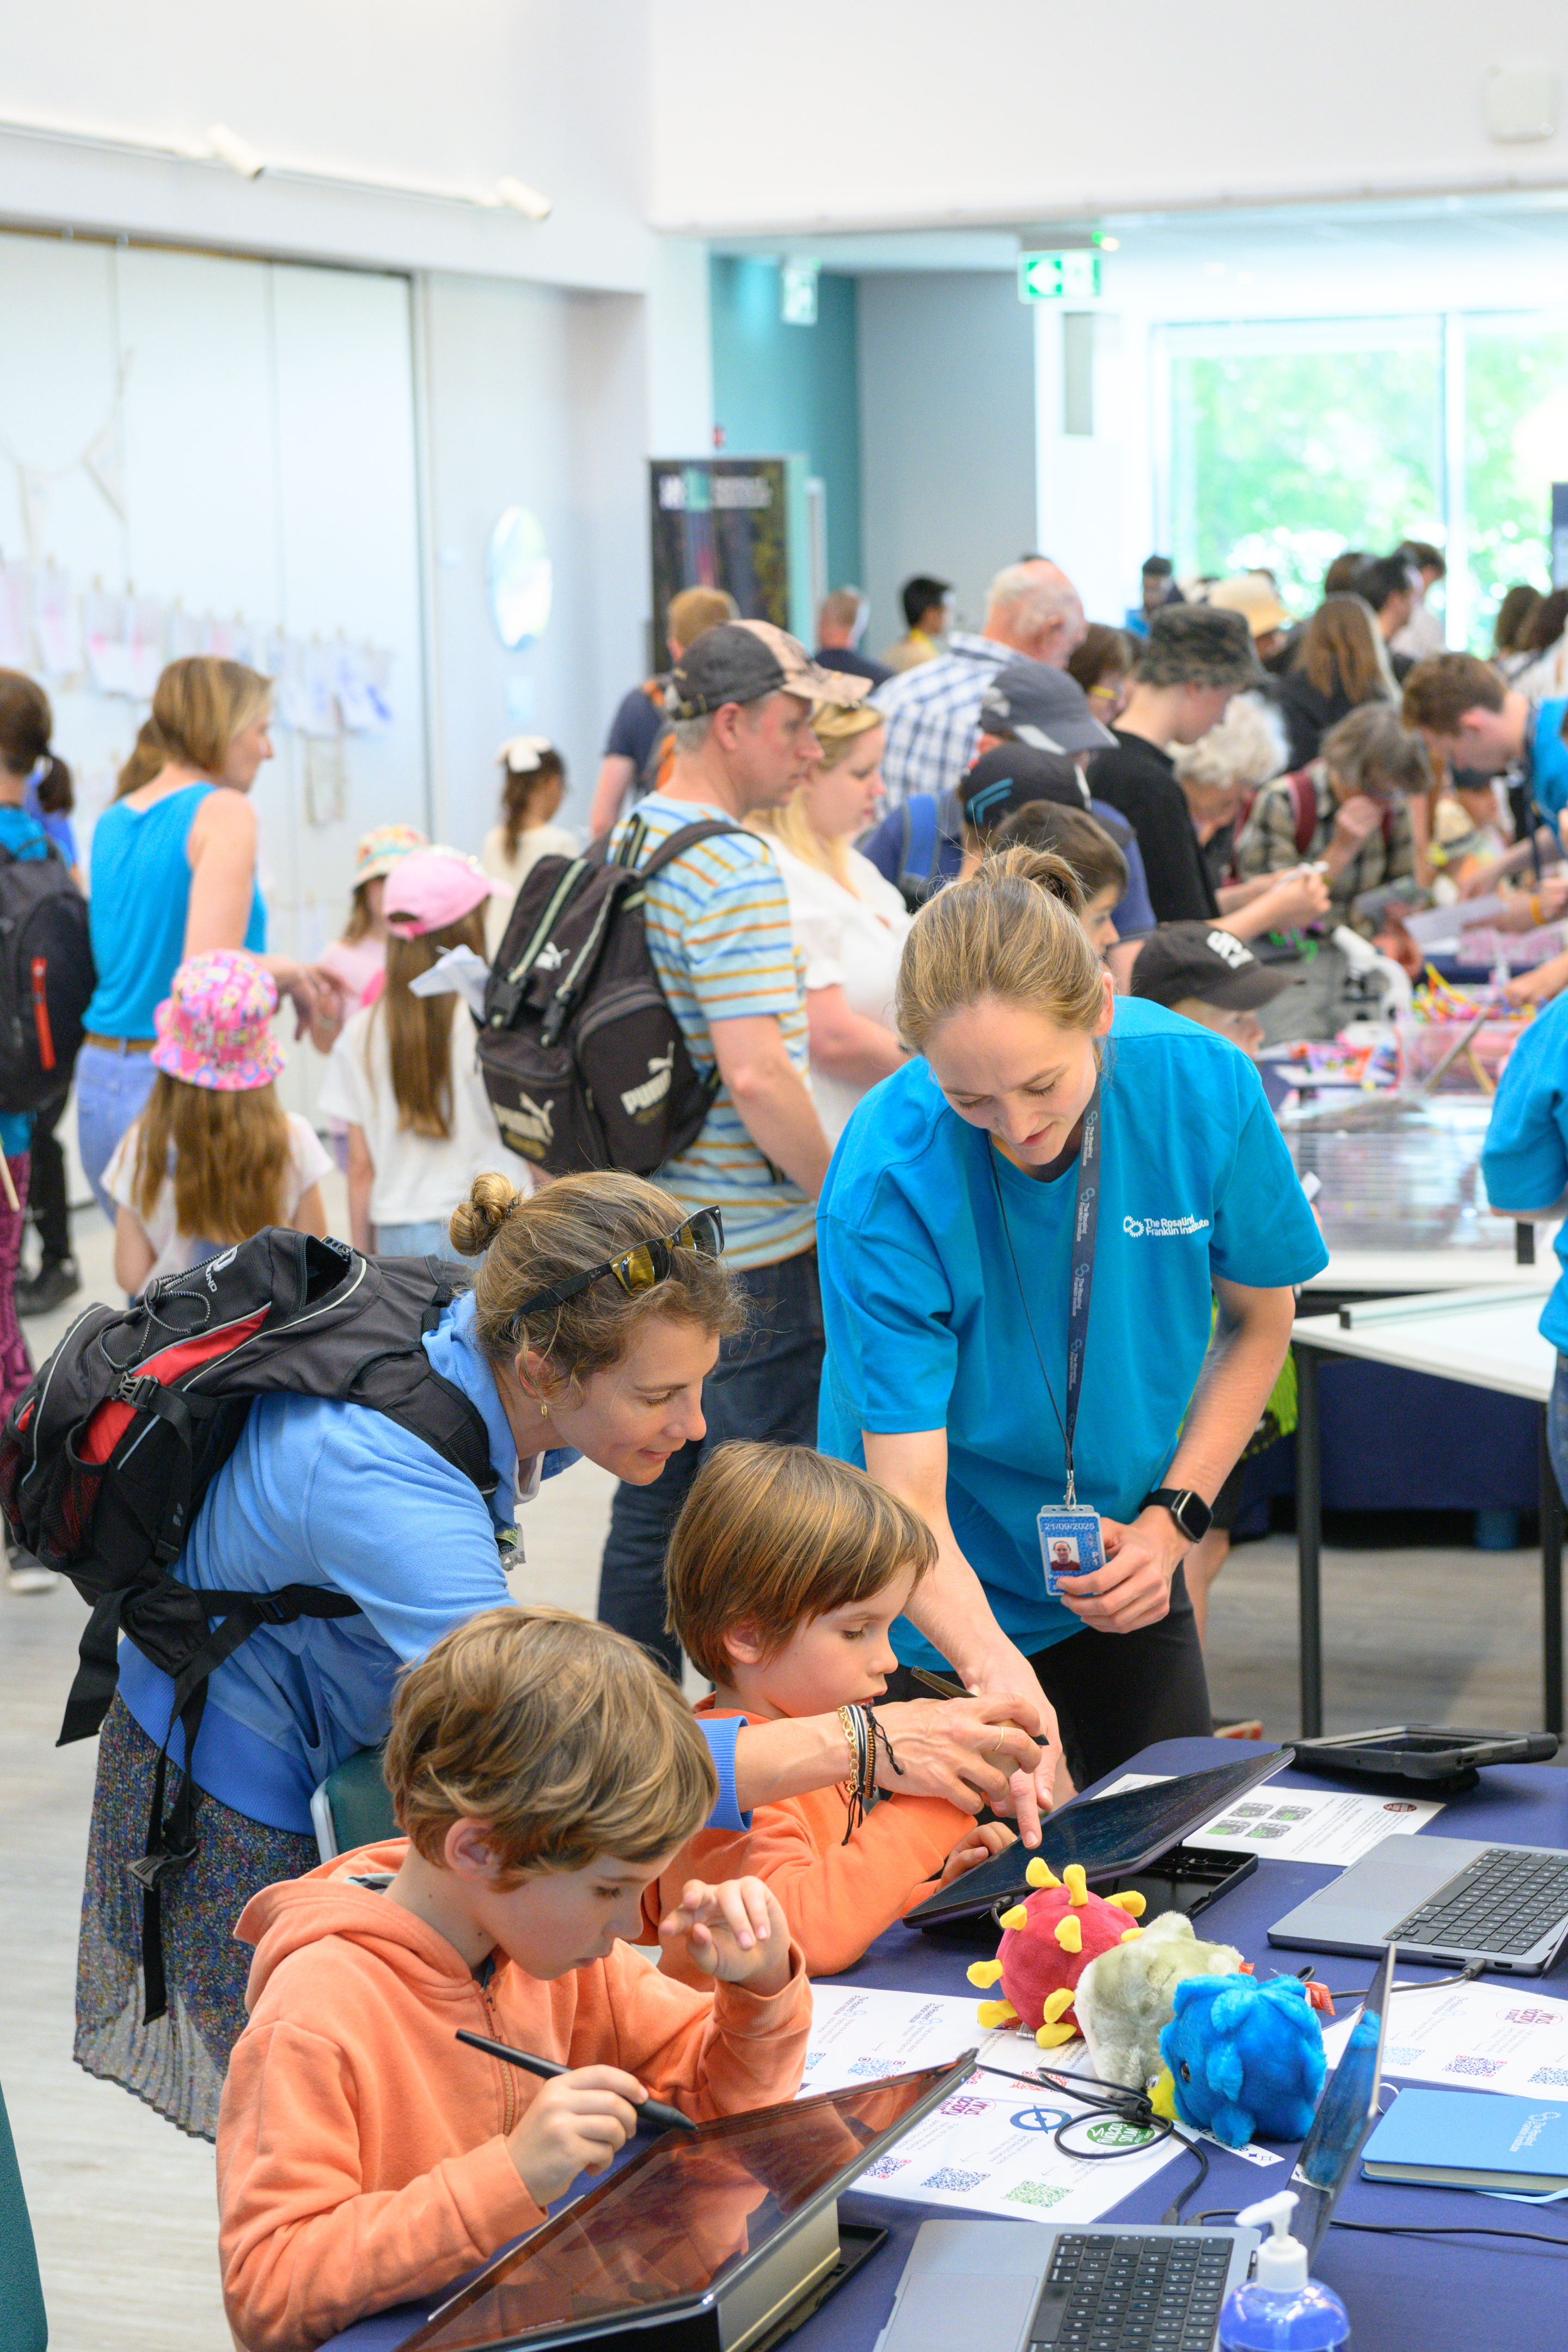
As a community manager, I wear a lot of different hats! My formal background is materials science and biomaterials, but I’m now the ‘citizen science specialist’ in a lot of my day-to-day research. I work alongside imaging specialists, software engineers, and experts in a variety of biosciences to help them design interesting, effective, and worthwhile projects on the Zooniverse. Essentially, I make sure that the experts are asking the right questions, in the right way, for our volunteers to be able to understand and contribute most effectively to our research.
I also spend a lot of time supporting our Science Scribbler community and making sure our volunteers are the first to hear about any project updates or research outcomes. The rest of my time is spent working with teachers to support them in using citizen science in the classroom through our Virus Factory in Schools project, and dabbling in a little bit of my own research too.
How do Zooniverse volunteers contribute to your research?
Most of the Science Scribbler projects launched so far have focused on 3D biological imaging data. When we ask questions about a particular sub-cellular structure or disease, we usually have to go through a process called segmentation: essentially colouring in every pixel that we count as being part of a particular class or label. Automated segmentation methods are constantly improving, but most of the time they still require a lot of expert annotation to either train or finetune the segmentation model. Creating this annotation is a huge bottleneck in processing all the data we collect. As a consequence, we usually have to compromise in some way: looking at a smaller sample size or asking less complicated questions.
Where volunteers help us in our research is in providing the annotations we need to train or refine our segmentation models. Once we have segmentation models that are working well, we can start to ask the really interesting questions – like what differences can we see in the mitochondria of healthy or diseased placenta? And what does that mean for our understanding of that disease?
But using citizen science to train or finetune our models isn’t just about passing the workload from a researcher to the crowd – it’s so much more powerful than that. One thing I’m really interested in is how citizen science can impact the bias in our models. If one expert trains a model, it will ‘see’ what that one individual sees. But if a model is trained on thousands of eyes through citizen science, it has the potential to be less biased than the expert, and who knows what that will bring!
What’s a surprising or fun fact about your research field?
We collect a lot of data at the Rosalind Franklin Institute. Recently we celebrated reaching 1 petabyte of Franklin data with a petabyte party (yes, there was cake). A petabyte is one million gigabytes – a huge amount of data for anyone to analyse – hence why we know citizen science is so valuable in our research. But what astounds me is how biology is at a completely different level; you can store roughly 215 petabytes of data in just 1 gram of DNA. Mind: blown.
What first got you interested in research?
I’m very lucky that I was exposed to a lot of science and engineering from a very early age. I think I decided I’d be a biochemist when I was just 9 years old, but in the end materials science stole my heart! There’s something fundamentally rewarding about being able to look at my everyday environment and ask: “How does this work?”, “What is this made of?” and most importantly “Why????”
In my role I’ve learned a lot about the impact science capital can have on a child’s attitude towards science and STEM careers. It’s part of why I think science communication is so important, and why I chose to work in a position that allows me to share my love of science with so many people.
What’s something people might not expect about your job or daily routine?
I really enjoy hiking and skiing in the alps, DnD, board games, and a good flat white. I also spent a decade dedicating half my time to rowing – when I started this role I was working part-time alongside training as a full-time athlete.
What are you favourite citizen science projects?
Too many to count! I’m always very nosey when a new project launches on the Zooniverse, so I try to submit at least a few classifications for each one. I really like using the Zooniverse app, so Gwitch Hunters comes to mind there. I also really enjoy the Etch A Cell projects, HMS NHS, and Monkey Health Explorer. The first project I contributed to was Civil War Bluejackets. Following the progress on the project over the last 3 years has been really easy thanks to their amazing blog and newsletters. They recently moved from full transcription (which I did a lot of) to correcting the automated transcriptions that were trained on our original work. It’s really cool to see the project progress in real time like that!
What guidance would you give to other researchers considering creating a citizen research project?
Getting a fresh pair of eyes on your data is really important in project design – sometimes you know the data too well and you’ll be blind to some really simple changes that will make your workflows much more straightforward. Remember to provide positive and negative examples – not just what you should do, but what you shouldn’t do as well. Finally, be ready to respond to your community in the early stages of the project. The first few weeks are really where you build out your FAQs and refine your field guide – especially if your volunteers find unusual examples in your dataset!
Is there anything else you would like to share with our readers?
I wanted to say a huge thank you to our Science Scribbler community! Since our first project launched in 2018, you have contributed over 4.4 million classifications to our projects. That’s the equivalent of 10 years of effort from a full-time employee!
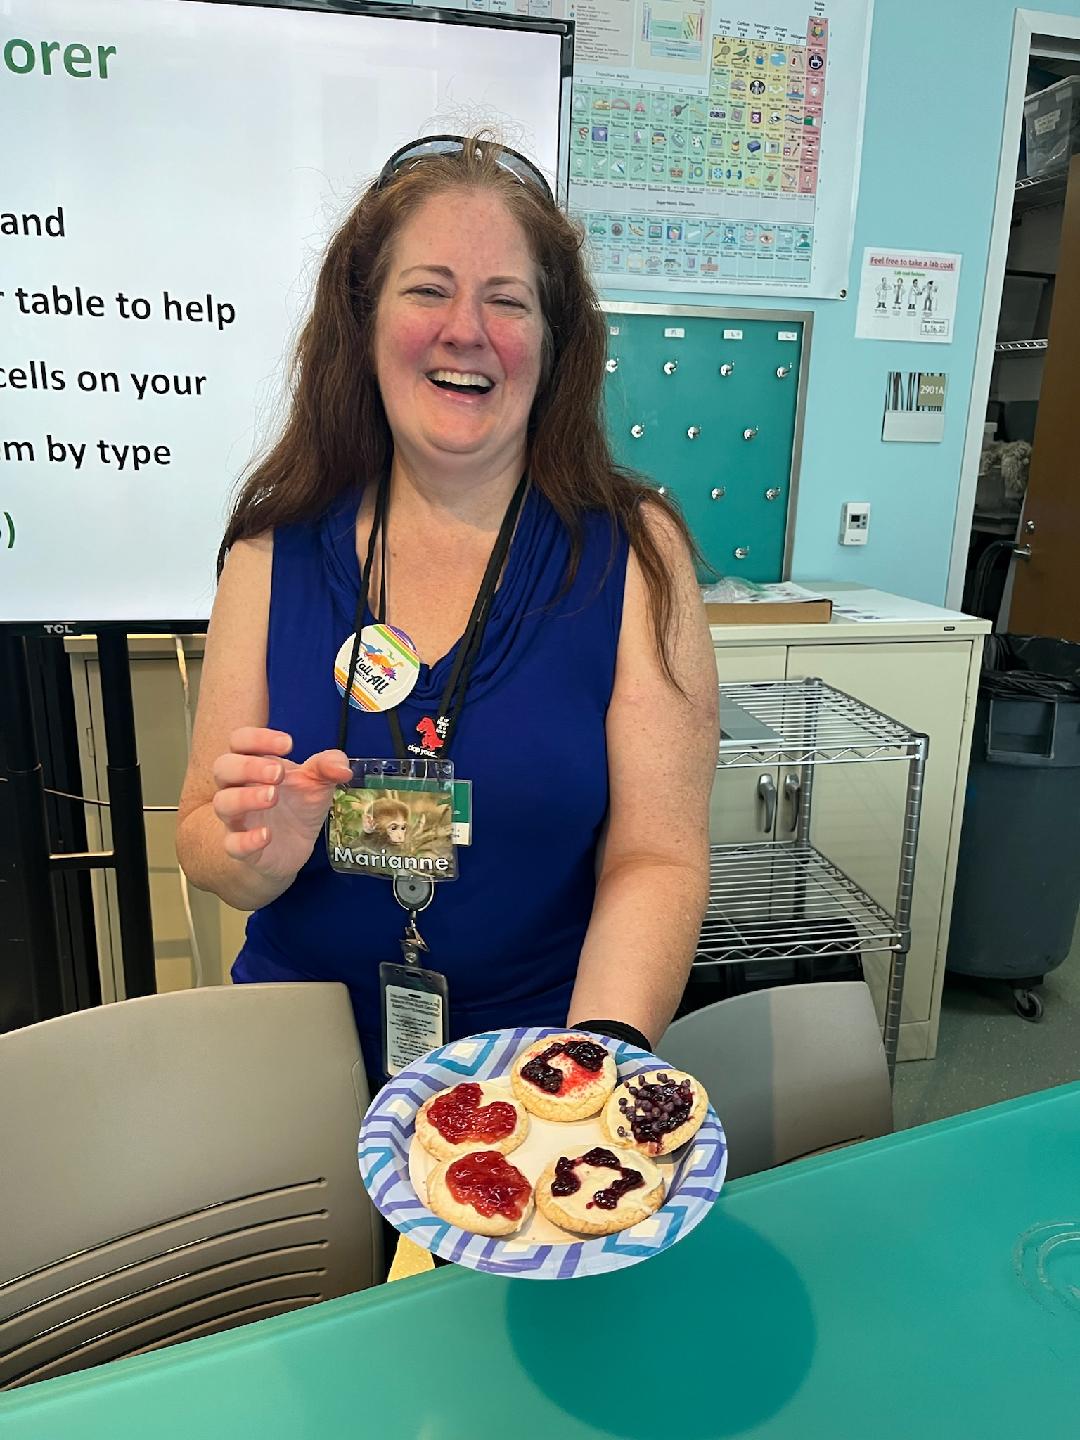
I’m actually trained in genetics and using DNA as a tool, so I’ve had to expand my knowledge to other areas as we set up our Monkey Health Explorer project. This project is one piece of a larger puzzle being assembled by a collaborative group of scientists all studying different aspects of a colony of Rhesus macaque monkeys living on an island off the coast of Puerto Rico. Our piece involves examining the blood of these monkeys to get a snapshot of their health, just like when we have our blood drawn at a doctor’s office. The data we collect about the blood cells is then examined alongside data from other researchers, such as behavioral or gene expression data, to tell more about each monkey.
How do Zooniverse volunteers contribute to your research?
The primary focus of our project is to count the 5 types of white blood cells in blood smears in order to determine if these numbers are in the “normal” ranges for a healthy monkey or if they might indicate the monkey is sick. Our volunteers learn about the visual features of each type of white blood cell and contribute to our research by identifying the white blood cells in blood smear images from our monkeys. We then summarize the results from all volunteers to give us the white blood cell counts for each monkey sample.
In addition to helping us identify these cells, we have several volunteers who are trained cell professionals or medical or veterinary students who have given us additional insights into our monkeys. They have pointed out unique patterns in the cells that indicate specific illnesses, such as parasitic infections.
What’s a surprising or fun fact about your research field?
Rhesus macaque blood cells look very similar to human blood cells. I learned how to identify the cells in our project using training materials for human blood.
The “positive” and “negative” part of our blood types is called the “Rh factor” because that particular type of blood protein was first identified in Rhesus macaque monkeys.
What first got you interested in research?
I’ve always loved learning how things work and was a big fan of the TV show MacGyver because he could figure out how to resolve a problem by using items he had around him. This inspired me to think about how to approach a problem from multiple views and come up with potential solutions using standard and non-standard methods.
What’s something people might not expect about your job or daily routine?
The lab I work in is inside of a Museum and has glass walls, so visitors can watch us work. Sometimes when I step outside the lab, I end up talking with visitors about what we’re doing and answering their questions about what they can see, such as our DNA sequencers and liquid handling robot. We also have special events at the Museum where I have the opportunity to share about our Monkey Health Explorer project to visitors and also host teacher training workshops to show them how to incorporate our project into their classroom with the educational materials we’ve developed.
Outside of work, what do you enjoy doing?
My love of learning extends to everything – I read/listen to audiobooks (mysteries lately), have 3 languages going on Duolingo (French, Spanish, German), rotate between crafty hobbies (painting, drawing, knitting, 3D print design), play multiple instruments (learning drums now), and recently added 2 bee hives to our garden.
What are you favourite citizen science projects?
I do love adding photos to iNaturalist as I come across new (to me) creatures and plants as I explore outside.
What guidance would you give to other researchers considering creating a citizen research project?
I would suggest spending time exploring several projects that have similarities to what you’re thinking of designing and use these as guides to consider what type of information you want to get from your project and how best to design training to make it interesting and accessible to volunteers. Also, make use of the Zooniverse Talk to interact with other project researchers to gain insights and learn from them. It’s a great community with a wealth of knowledge and experience!
In this edition of Who’s who in the Zoo, meet Ameenat Lola Solebo who leads Eyes on Eyes ; a Zooniverse project that aims to improve how we monitor children with a blinding eye disorder.
Who: Ameenat Lola Solebo, Clinician Scientist (Paediatric Ophthalmology / Epidemiology & Health Data Science)
Location: UCL GOS Institute of Child Health and Great Ormond Street Hospital
We’re asking Zooniverse volunteers to label eye images of children with or at risk of a blinding disease called uveitis. Early detection of uveitis means less chance of blindness, but it is becoming increasingly difficult for children to access the specialised experts they need to detect uveitis at an early stage (before the uveitis has caused damage in side the eye). New ‘OCT’ (eye cameras) may provide detailed enough images of the eye to allow even non specialists to detect uveitis at the early stages. Our research studies develop and evaluate OCT methods for uveitis detection and monitoring in children, and during these studies we collect a lot of data from children’s eyes – sometimes several hundred scans in different positions just from one child. We are hoping that we don’t need to keep on collecting this many images in the long run, but we have to know where and how best to look for problems.
How do Zooniverse volunteers contribute to your research?
Zooniverse volunteers are asked to label scans in different ways. They can tell us what they think of the quality of an individual scan – is it good enough to be useful? They can point out which features of the scan are making it poorer quality so that we can judge how useful it might be. They can draw regions of interest on the scan, helping to focus attention. They can also pick up the signs of uveitis – inflammatory cells floating around in the usually dark space inside the eye, looking like bright stars in a dark sky. They can tell us if they can see cells, how many cells they can see, and they can locate each cell for us. The quality judgements submitted by the volunteers have compared favourably to expert judgement, which is great. We have since developed a quality assessment algorithm based on labels from the Zooniverse volunteers. We are now looking to just how accurate the volunteer assessments of the images are compared to the clinical diagnosis of the child.
What’s a surprising fact about your research field?
Uveitis is often autoimmune, meaning your body turns against the delicate tissues in your eye — especially the uvea, a highly vascular layer that includes the iris. It’s like friendly fire… which is such an awful term, isn’t it?
What first got you interested in research?
I was tired of answering “we don’t know” when parents asked us questions about their child’s eye disease.
What’s something people might not expect about your job or daily routine?
Someone asked me how I put back the eye after doing eye surgery – ophthalmic surgeons do not, I repeat do not remove the eye from patients to operate on them! Also – I think that people may be surprised about how beautiful the eye looks when viewed at high mag. Ophthalmologists use a microscope called a slit lamp to look at and into a patient’s eye. The globe is such a fragile, well constructed, almost mystical body part, and vision is practically magic!
Outside of work, what do you enjoy doing?
I recently started karate. I am by far the oldest white belt and I am really loving making the KIAI! noises.
What are you favourite citizen science projects?
The Etch A Cell projects, because I learnt so much how to run my own project from that team and Black hole hunters, because they are great at describing what they have done with volunteer data.
What guidance would you give to other researchers considering creating a citizen research project?
Do it! And do it on Zooniverse, because the community is super engaged and the back of house team are so supportive. Stay active on talk boards to engage volunteers. And test, refine, test, refine your project until you start seeing it in your sleep.
And finally…
Thank you to all the volunteers who have been helping us!
We are looking for Herbig-Haro (HH) objects, which are jets of gas produced by newly-forming protostars. They are important because they can show us where stars are forming right now. HH objects are quite beautiful and rare – only about a thousand of them are known to exist!
How do Zooniverse volunteers contribute to your research?
We are searching for HH objects in giant clouds of gas inside our galaxy using the Dark Energy Camera (DECam) on the Blanco 4-meter telescope at the Cerro Tololo Interamerican Observatory in Chile. The images produced by this camera are huge – 570 megapixels each – and are too big for a single person to look at. That’s where Zooniverse came in. We divided each image into smaller, 512×512, “cutouts” for people to search. We’ve completed the analysis and Zooniverse volunteers found 169 new HH objects! Considering only about 1200 were known to exist before this is a big increase.
What’s a surprising or fun fact about your research field?
Jets of gas occur in our universe on a wide range of scales. All of them are produced when gas is swirling around a central object. In the case of Herbig-Haro objects the jets are produced by gas moving around a protostar. These jets can extend over several light years. Jets are also produced by gas swirling around black holes. In quasars, these jets are powered by “supermassive” black holes and the jets produced can extend for several hundred thousand light years. What’s amazing is how similar all these jets are to each other despite the tremendous differences in size.
What first got you interested in research?
I first started doing research on quasar jets with Dr. David Hough when I was an undergraduate student at Trinity University.
What’s something people might not expect about your job or daily routine?
People often imagine that astronomers sit inside a dome every night looking through a telescope. In reality the telescopes we use have digital cameras and instruments that collect the data. Nowadays we can operate most telescopes remotely. So most of my research right now is done with telescopes in Chile that I can operate with my laptop computer from the comfort of my kitchen!
Outside of work, what do you enjoy doing?
One of my hobbies is turning the data we get from our telescopes into color images. They’re a great way to share the beauty of the universe, and share the research that we do. I’ve been doing this for over 25 years now, and most of these images are available in the NOIRLab image gallery. Living in Alaska I love to do a wide range of outdoor activities, but my passion is for snow. In particular I love to cross-country ski.
What guidance would you give to other researchers considering creating a citizen research project?
It was a lot easier than I had imagined it would be to set up. Zooniverse is great about helping out, and beta testers also had a lot of important feedback. Once your project is up and running be prepared for a tsunami of enthusiastic volunteers who will have a lot of questions. We also had several volunteers to translate our project into other languages, which was great for increasing participation.
And finally…
Here’s one of our color images of one of the regions we studied looking for Herbig Haro objects (you can read more about this here).
A celestial shadow known as the Circinus West molecular cloud
As the U.S. Congress deliberates on next year’s budget, proposed 50% cuts to agencies like NASA and the National Science Foundation (NSF), and the deeply concerning layoffs at the Institute of Museum and Library Services (IMLS), the National Endowment for the Humanities (NEH), and the National Endowment for the Arts (NEA), jeopardize the work of organizations like Zooniverse that rely on federal funding.
Although Zooniverse is an international collaboration, with core institutional partners in both the U.S. and the UK, this post focuses on the vital role that U.S. federal support has played in enabling our impact. As these funding decisions are made, we wanted to share how essential this support has been to Zooniverse’s impact on research and public engagement.
From the start, federal grants have been a cornerstone of Zooniverse’s ability to innovate and scale. A seed grant from the NSF in 2009 helped us explore the integration of machine learning with participatory science, work that laid the foundation for Zooniverse to become one of the world’s most sophisticated platforms for AI-enhanced crowdsourced research. A grant from IMLS advanced our Digital Humanities efforts, and a follow-on NEH grant enabled us to build critical infrastructure, like our ALICE system, for reviewing and editing transcriptions across humanities projects. Most recently, support from the National Institutes of Health (NIH) enabled a new initiative to render three-dimensional subjects within Zooniverse, expanding the platform’s capabilities to advance biomedical research.
Federal support has also been instrumental in strengthening Zooniverse’s public impacts, from an NSF Improving Undergraduate STEM Education (IUSE) grant that led to the creation of classroom.zooniverse.org to an NSF Advancing Informal STEM Learning (AISL) grant that launched a multi-person Galaxy Zoo touch table exhibit at the Adler Planetarium in Chicago. This hands-on experience reaches tens of thousands of visitors each year and often serves as the first entry point for children and their families into the world of participatory science.
Crucially, these federal grants don’t just fund abstract ideas or technologies, they fund people. Federal support helps pay the salaries of the software engineers, researchers, and participatory science professionals who build and maintain the Zooniverse platform, collaborate with research teams, and support our community of nearly 3 million volunteers.
Our current NASA grant, for example, enables over two dozen NASA research teams to unlock their datasets through Zooniverse and funds core platform maintenance efforts, an area of support notoriously difficult to secure. Our NASA grant also allowed us to respond directly to community needs through the implementation of new Group Engagement features and student service hours support, among the most requested tools from educators, classrooms, museums, and others using Zooniverse in group settings around the world.
Today, Zooniverse is part of the core infrastructure of research and scholarship. We partner with more than 150 research institutions and nearly 3 million volunteers worldwide. Our platform is a critical tool in the modern researcher’s toolkit, including in fields relying on human-in-the-loop AI methods to analyze vast datasets. At the same time, we are a trusted platform for public engagement, helping build confidence in science and fostering a sense of shared purpose across disciplines, borders, and backgrounds.
Like many research and public engagement organizations, Zooniverse has deeply benefitted from federal grant support. We felt it was important to share with our communities just how vital this support has been. Much of what we’ve built — our infrastructure, partnerships, and public-facing tools — would not have been possible without it. Continued federal investment remains critical to sustaining and growing this work.
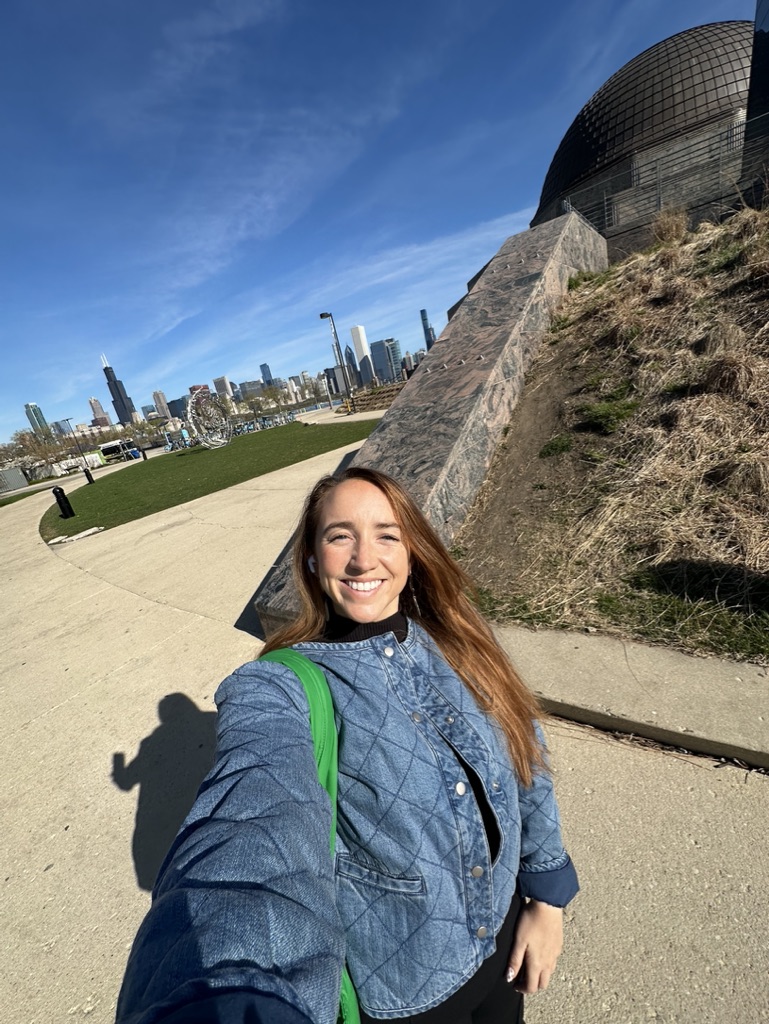
I hadn’t even walked in the door yet, and walking up to my first day working at Adler Planetarium/Zooniverse was already one of the coolest places I’ve ever worked. The bus dropped me off, and because of the schedule, I arrived about 15 minutes early. I was extremely eager to begin this summer but decided to take a moment and sit on a bench close by to take in the beautiful view of Lake Michigan and the Chicago skyline. I had no idea what the summer was about to hold.
Why science communication?
I took a long, winding road to get to Adler/Zooniverse this summer, but the timing was perfect. I have always prioritized public engagement and science communication in my work, and it began in undergrad, where I was a tour guide and a teaching assistant. After graduation, I started working as a high school math teacher and presenting live science shows at the planetarium on the weekends. This combination of positions taught me how to do the seemingly impossible – get high schoolers excited about math. I brought my science communication training and the use of demos from the planetarium into the classroom to create an engaging environment. This led me to work as an instructor at a community college where I faced a different challenge – working with many varying backgrounds because most students came to my night class after working a long day job. I was teaching a math course with a supplemental lab where my focus was to get my students to build growth mindset skills, empowering them to succeed in my class. All these experiences led me to return to graduate school, where I continued to prioritize outreach, and I began the NASA-Zooniverse participatory science project Dark Energy Explorers. As project lead, this challenged me differently, acting as a liaison between highly specialized researchers and the general public.
While waiting to enter the building for the first time I took a walk around the whole planetarium only to be surprised with a glimpse of the Doane Observatory. Here, I paused for a first day picture to send to my family!
I say all of this because, before this summer, I felt like I was building all these skills out of sync and never in tandem. This summer at Adler/Zooniverse was the first time I truly had the opportunity to intertwine all these skills I’ve built over the years in one position while also gaining new skills from the experts here. I came to Adler/Zooniverse through the NSF Non-Academic Research Internships for Graduate Students (INTERN) for graduate students looking to grow a complementary skill set outside of an academic setting. Being a Zooniverse project lead and someone with an informal education background, coming to Adler/Zooniverse to focus on science communication skills was a perfect fit. Zooniverse PI, Laura Trouille, was my main mentor throughout the experience.
This summer, all of the projects I took on fell into the following modes of communication– written (articles, storybooks), spoken (talks, explanations), and visual (video, graphics, social media).
Networking and gaining skills
My first week, I was thrown right into filming for Adler’s social media’s ‘Ask an Astronomer’ segment. This might have been some of the most fun I had. I worked with other Adler astronomers, Mike Zevin and Geza Gyuk, to write answers to some of the most frequently asked questions in astronomy with an extra challenge of it could only be one minute long. We filmed with the marketing team Bella, Audrey, and Colleen, seen here, where we spent most of the filming perfecting a swivel chair spin. In addition to these videos for Adler social media, I also worked on a few posts for NASA Citizen Science and explored the Zooniverse social media revamp with Alisa Apreleva at Oxford University.
Continuing to work with Mike Zevin, I took on a project to develop a new way to incorporate Zooniverse into the Astronomy Conversations program at Adler. Astronomy Conversations is a program that hosts researchers and visiting scientists to engage with museum guests about their research. We discovered a way to use the space visualization lab to project a Zooniverse project and then use a project as a take-home activity for visitors. For instance, if a guest was particularly interested in asteroids, they classify on Asteroid Hunters in the SVL and then continue learning at home on their own on Zooniverse.
Before this summer, I had no video editing skills and barely knew how to use iMovie. With a tutorial from Laura, and design help from Zooniverse Designer Sean Miller, I put together a video for educators using the new Zooniverse Groups features. This video helps educators of all kinds (teachers, camp counselors, museum leads, librarians, etc.) to feel comfortable and confident using the new features in their education setting.
Becoming a ‘consultant astronomer’
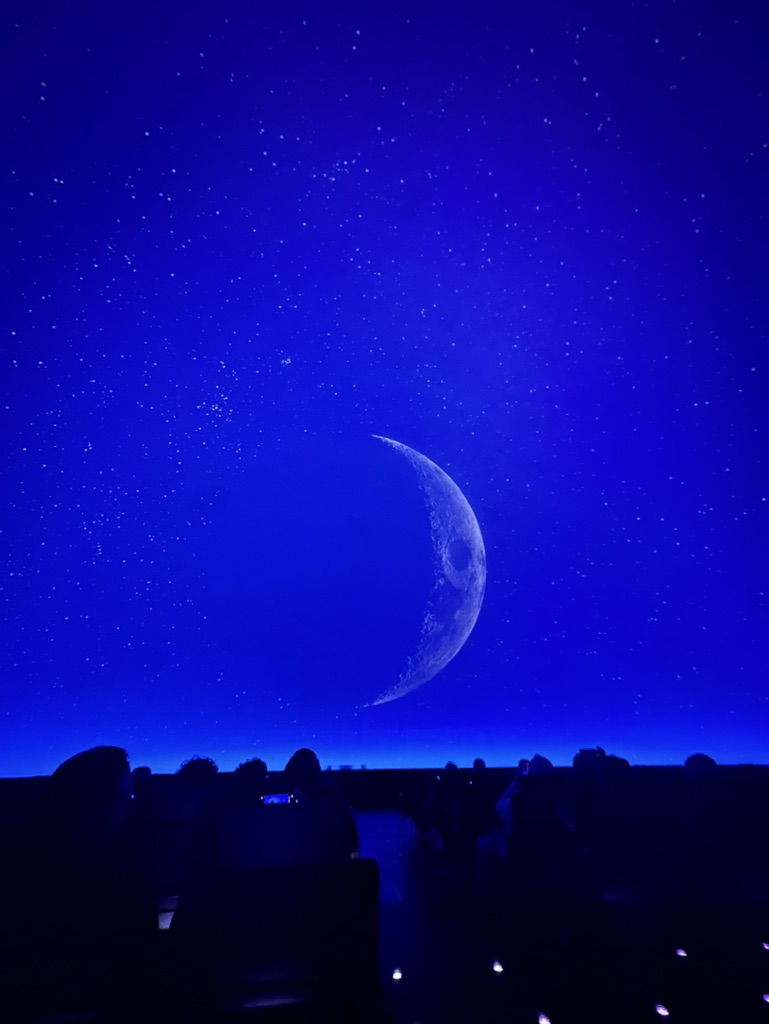
My most novel experience was working with Adam Fotos (professor at Chicago State University) as a ‘consultant astronomer’ (I just made that title up). Adam contacted the team for advice for his new children’s book, Growing to the Moon. He wanted to ensure some of the book was rooted in actual astronomy concepts while still maintaining a fantastical, fun story. I agreed to help him tackle this task and then attended one of the planetarium shows at Adler, Imagine the Moon. Following this, we discussed incorporating those ideas into the plot line and how it could appeal to kids of varying ages. Look out for his book to be published soon!
Meeting with Adam to consult for the storybook, we watched the Imagine the Moon planetarium show amongst many other excited Adler visitors.
Communicating science accessibly
One of my most significant points of personal growth this summer has been in my science writing. My love for writing has taken a new perspective as I’ve been able to learn how to communicate my research on very niche astronomy topics, like dark energy or machine learning, for the general public. I was able to share part of my journey of choosing astronomy in the ‘working life’ section of Science Magazine, which culminated with my presentation of three posters and a talk at the International Astronomical Union Meeting in Cape Town, South Africa!
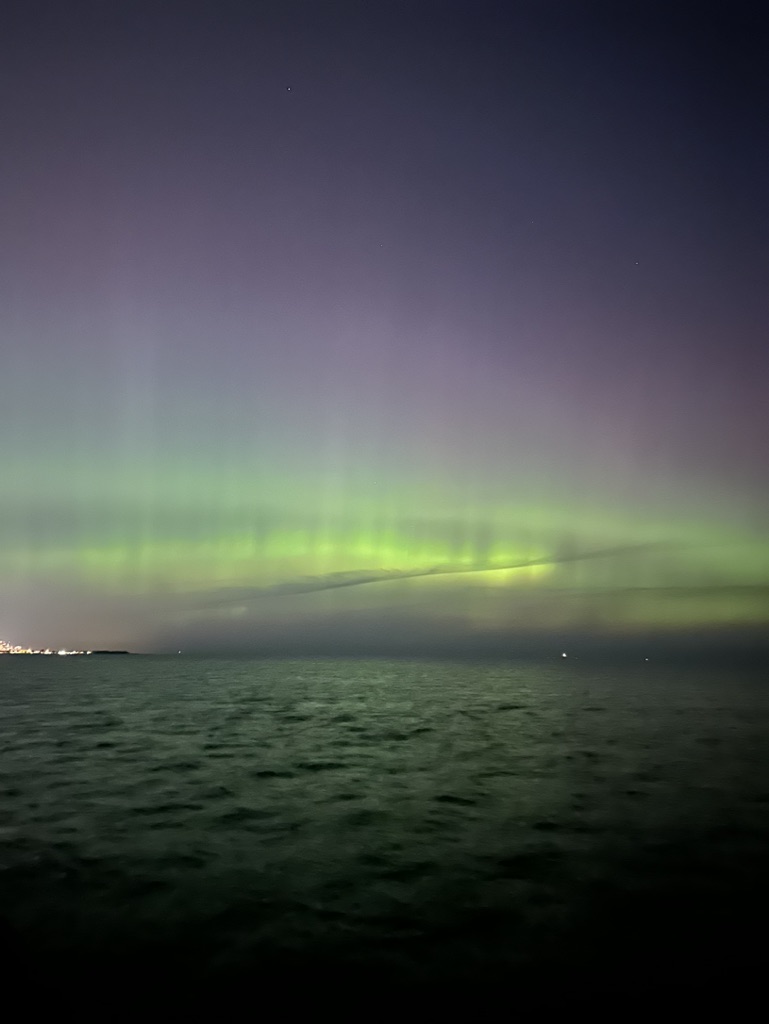
In addition to all the inspirational things that happened at work, I witnessed the auroras in the middle of Chicago off of North Ave pier, reflecting off Lake Michigan!
Place to learn and grow
After one of the most fullfilling summers of my life, I can reflect back to that first day after I walked through the door and Laura began showing me around the building. Along the way we ran into Adler President, Michelle Larson. The three of us had a lovely chat about how excited we were about what the summer would hold and how quickly it would go by. That was an understatement. In hindsight, that conversation was representative of the next few months. I witnessed the exceptional work environment these ladies (and the whole team!) have created here. They have made Adler and Zooniverse places where people come to learn and grow, not only as science enthusiasts but as people. In my experience, this is very rare to find. From the projects, to the people, to the place of Chicago, I spent this summer learning, laughing, and growing as a science communicator and a human. I’m grateful for the opportunity to be a part of this community through the NSF INTERN program, and I hope to continue collaborating with the Adler/Zooniverse team into the future!
The guest post was written by Lindsay R. House, a Science Communicator with Adler Planetarium and Zooniverse in Chicago from April to August 2024. Lindsay is the project lead for the NASA-Zooniverse participatory science project, Dark Energy Explorers. Lindsay spent this time at Adler on a supplemental National Science Foundation INTERN grant, which allowed her to gain valuable science communication skills that complement her studies as a 5th-year Astronomy Ph.D. student at the University of Texas Austin.
This is a guest post by summer intern Anastasia Unitt.
The study of celestial objects creates a huge amount of data. So much data, that astronomers struggle to make use of it all. The solution? Citizen scientists, who lend their brainpower to analyse and catalogue vast swathes of information. Alex Andersson, a DPhil student at the University of Oxford, has been applying this approach to his field: radio astronomy, through the Zooniverse. I met with him via Zoom to learn about his project detecting rare, potentially explosive events happening far out in space.
Alex’s research uses data collected by a radio telescope located thousands of miles away in South Africa, named MeerKAT. The enormous dishes of the telescope detect radio waves, captured from patches of sky about twice the size of the full Moon. This data is then converted into images, which show the source of the waves, and into light curves, a kind of scatter plot which depicts how the brightness of these objects has changed over time. This information was initially collected for a different project, so Alex is exploiting the remaining information in the background- or, as he calls it: “squeezing science out of the rest of the picture.” The goal: to identify transient sources in the images, things that are changing, disappearing and appearing.
Historically, relatively few of these transients have been identified, but the many extra pairs of eyes contributed by citizen scientists has changed the game. The volume of data analysed can be much larger, the process far faster. Alex is clearly both proud of and extremely grateful to his flock of amateur astronomers. “My scientists are able to find things that using traditional methods we just wouldn’t have been able to find, [things] we would have missed.” The project is ongoing, but his favourite finding so far took the form of a “blip” his citizen scientists noticed in just two of the images (out of thousands). Alex explains: “We followed it up and it turns out it’s this star that’s 10 times further away than our nearest stellar neighbor, and it’s flaring. No one’s ever seen it with a radio telescope before.” His excitement is obvious, and justified. This is just one of many findings that may be previously unidentified stars, or even other kinds of celestial objects such as black holes. There’s still so much to find out, the possibilities are almost endless.
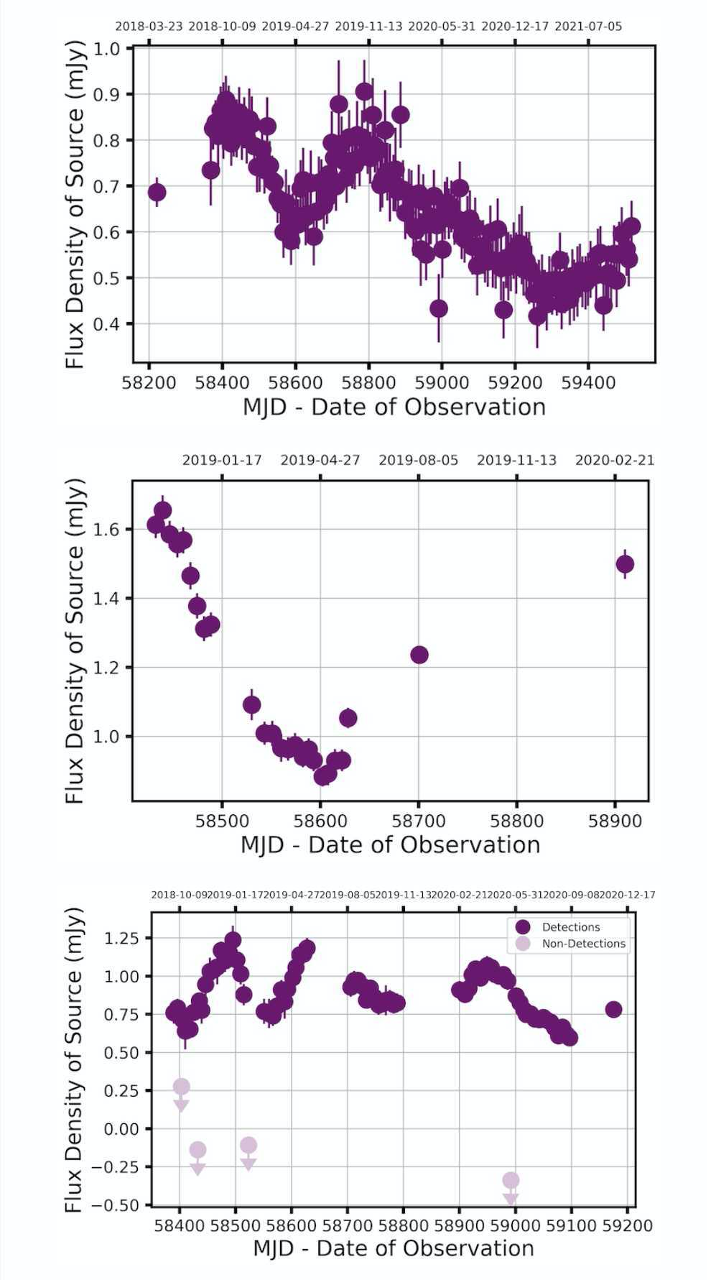
A range of light curve shapes spotted by Zooniverse citizen scientists performing classifications for Bursts from Space: MeerKAT
Unfortunately, research comes with its fair share of frustrating moments along with the successes. For Alex, it’s the process of preparing the data for analysis which has proved the most irksome. “Sometimes there’s bits in the process that take a long time, particularly messing with code. There can be so much effort that went into this one little bit, that even if you did put it in a paper is only one sentence.” These behind-the-scenes struggles are essential to make the data presentable to the citizen scientists in the first place, as well as to deal with the thousands of responses which come out the other side. He assures me it’s all worth it in the end.
As to where this research is headed next, Alex says the prospects are very exciting. Now they have a large bank of images that have been analysed by the citizen scientists, he can apply this information to train machine learning algorithms to perform similar detection of interesting transient sources. This next step will allow him to see “how we can harness these new techniques to apply them to radio astronomy – which again, is a completely novel thing.”
Alex is clearly looking forward to these further leaps into the unknown. “The PhD has been a real journey into lots of things that I don’t know, which is exciting. That’s really fun in and of itself.” However, when I ask him what his favourite part of this research has been so far, it isn’t the science. It’s the citizen scientists. He interacts with them directly through chat boards on the Zooniverse site, discussing findings and answering questions. Alex describes their enthusiasm as infectious – “We’re all excited about this unknown frontier together, and that has been really, really lovely.” He’s already busy preparing more data for the volunteers to examine, and who knows what they might find; they still have plenty of sky to explore.
The team behind the Exoplanet Explorers project has just published a Research Note of the American Astronomical Society announcing the discovery of 28 new exoplanet candidates uncovered by Zooniverse volunteers taking part in the project.
Nine of these candidates are most likely rocky planets, with the rest being gaseous. The sizes of these potential exoplanets range from two thirds the size of Earth to twice the size of Neptune!
This figure shows the transit dips for all 28 exoplanet candidates. Zink et al., 2019
Finally, both the Exoplanet Explorers and Zooniverse teams would like to extend their deep gratitude to all the volunteers who took part in the project and made these amazing discoveries possible.
The world's largest and most popular platform for people-powered research. This research is made possible by volunteers—millions of people around the world who come together to assist professional researchers.