An apology is owed to all Zooniverse volunteers; We incredibly underestimated the Zooniverse Community’s ability to mobilize for the Sunspotter Citizen Science Challenge. You blew our goal of 250,000 new classifications on Sunspotter in a week out of the water! It took 16 hours to reach 250,000 classifications. I’ll say that again, 16 hours!
By 20 hours you hit 350,000 classifications. That’s an 11,000% increase over the previous day. By the end of the weekend, the total count stood at over 640,000.
Let’s up the ante, shall we? Our new goal is a cool 1,000,000 classifications by Saturday September 5th. That would increase the total number of classifications since Sunspotter launched in February 2014 by 50%!
Calling all Zooniverse volunteers! As we transition from the dog days of summer to the pumpkin spice latte days of fall (well, in the Northern hemisphere at least) it’s time to mobilize and do science!
Our Zooniverse community of over 1.3 million volunteers has the ability to focus efforts and get stuff done. Join us for the Sunspotter Citizen Science Challenge! From August 29th to September 5th, it’s a mad sprint to complete 250,000 classifications on Sunspotter.
Sunspotter needs your help so that we can better understand and predict how the Sun’s magnetic activity affects us on Earth. The Sunspotter science team has three primary goals:
Hone a more accurate measure of sunspot group complexity
Improve how well we are able to forecast solar activity
Create a machine-learning algorithm based on your classifications to automate the ranking of sunspot group complexity
Classifying on Sunspotter
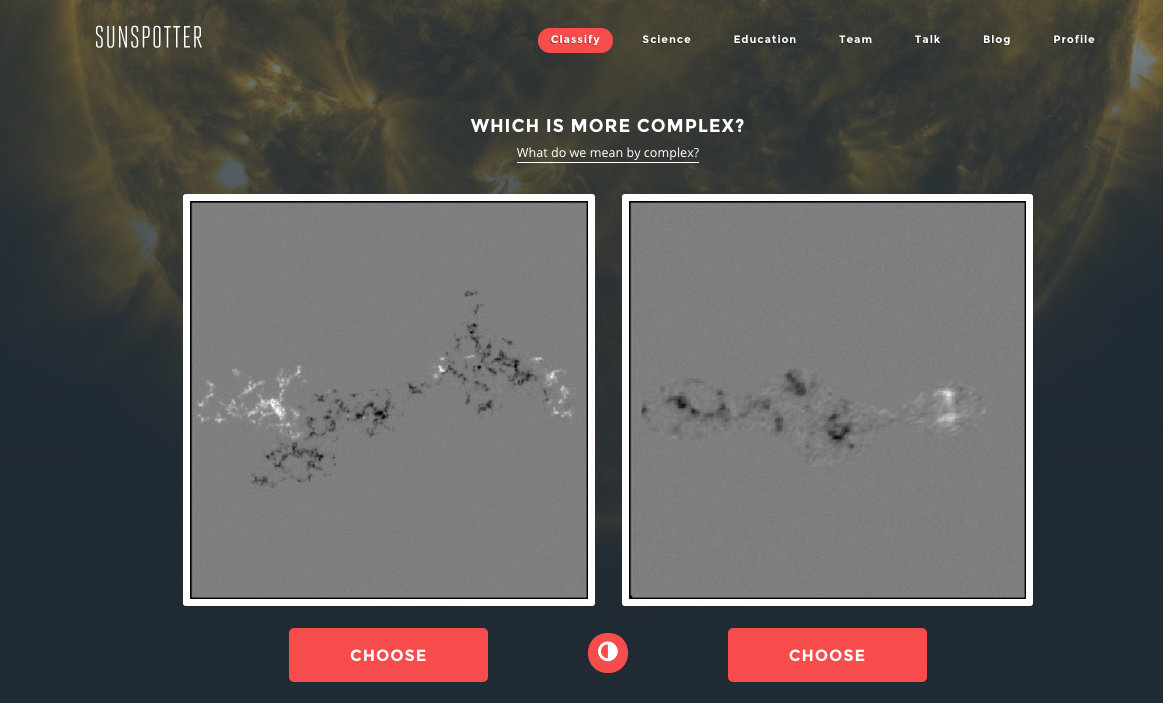
In order to achieve these goals, volunteers like you compare two sunspot group images taken by the Solar and Heliospheric Observatory and choose the one you think is more complex. Sunspotter is what we refer to as a “popcorn project”. This means you can jump right in to the project and that each classification is quick, about 1-3 seconds.
Let’s all roll up our sleeves and advance our knowledge of heliophysics!
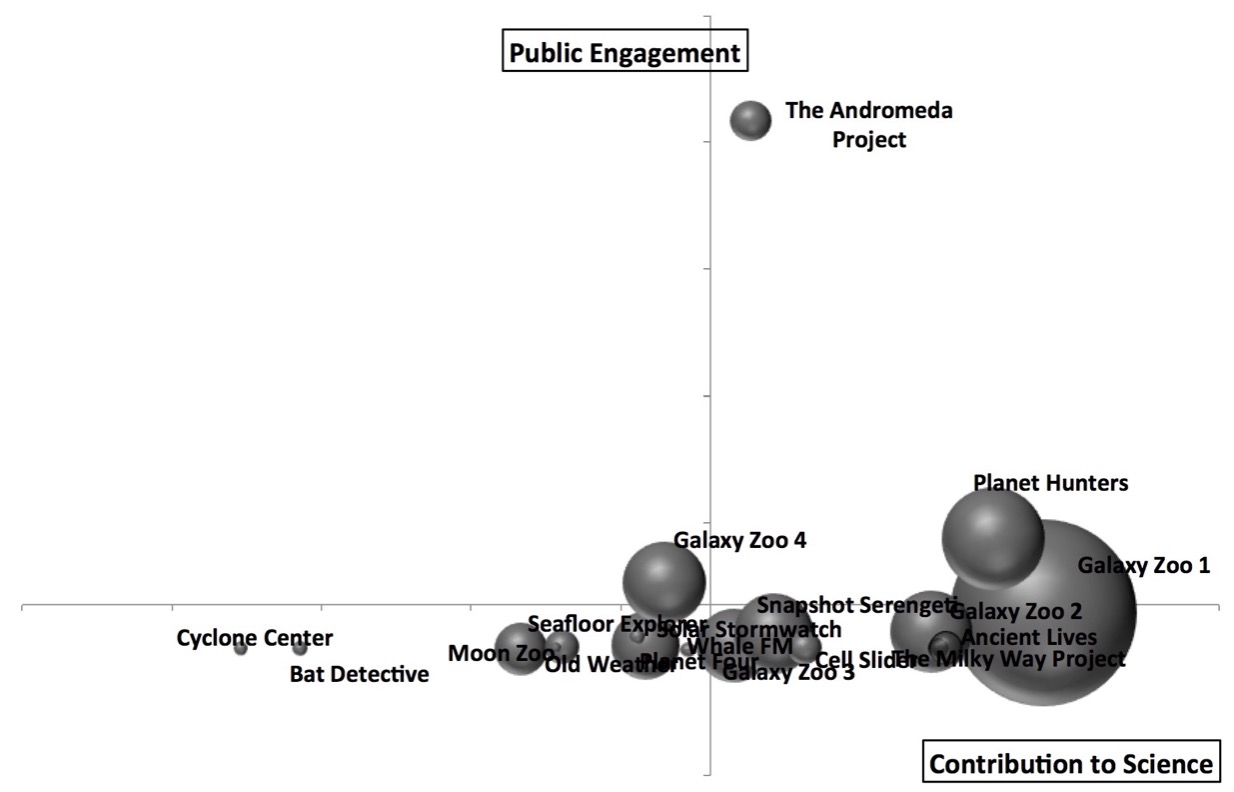
In the previous post, I described the creation of the Zooniverse Project Success Matrix from Cox et al. (2015). In essence, we examined 17 (well, 18, but more on that below) Zooniverse projects, and for each of them combined 12 quantitative measures of performance into one plot of Public Engagement versus Contribution to Science:
Public Engagement vs Contribution to Science for 17 Zooniverse projects. The size (area) of each point is proportional to the total number of classifications received by the project. Each axis of this plot combines 6 different quantitative project measures.
The aim of this post is to answer the questions: What does it mean? And what doesn’t it mean?
Discussion of Results
The obvious implication of this plot and of the paper in general is that projects that do well in both public engagement and contribution to science should be considered “successful” citizen science projects. There’s still room to argue over which is more important, but I personally assert that you need both in order to justify having asked the public to help with your research. As a project team member (I’m on the Galaxy Zoo science team), I feel very strongly that I have a responsibility both to use the contributions of my project’s volunteers to advance scientific research and to participate in open, two-way communication with those volunteers. And as a volunteer (I’ve classified on all the projects in this study), those are the 2 key things that I personally appreciate.
It’s apparent just from looking at the success matrix that one can have some success at contributing to science even without doing much public engagement, but it’s also clear that every project that successfully engages the public also does very well at research outputs. So if you ignore your volunteers while you write up your classification-based results, you may still produce science, though that’s not guaranteed. On the other hand, engaging with your volunteers will probably result in more classifications and better/more science.
Surprises, A.K.A. Failing to Measure the Weather
Some of the projects on the matrix didn’t appear quite where we expected. I was particularly surprised by the placement of Old Weather. On this matrix it looks like it’s turning in an average or just-below-average performance, but that definitely seems wrongto me. And I’m not the only one: I think everyone on the Zooniverse team thinks of the project as a huge success. Old Weather has provided robust and highly useful data to climate modellers, in addition to uncovering unexpected data about important topics such as the outbreak and spread of disease. It has also provided publications for more “meta” topics, including the study of citizen science itself.
Additionally, Old Weather has a thriving community of dedicated volunteers who are highly invested in the project and highly skilled at their research tasks. Community members have made millions of annotations on log data spanning centuries, and the researchers keep in touch with both them and the wider public in multiple ways, including a well-written blog that gets plenty of viewers. I think it’s fair to say that Old Weather is an exceptional project that’s doing things right. So what gives?
There are multiple reasons the matrix in this study doesn’t accurately capture the success of Old Weather, and they’re worth delving into as examples of the limitations of this study. Many of them are related to the project being literally exceptional. Old Weather has crossed many disciplinary boundaries, and it’s very hard to put such a unique project into the same box as the others.
Firstly, because of the way we defined project publications, we didn’t really capture all of the outputs of Old Weather. The use of publications and citations to quantitatively measure success is a fairly controversial subject. Some people feel that refereed journal articles are the only useful measure (not all research fields use this system), while others argue that publications are an outdated and inaccurate way to measure success. For this study, we chose a fairly strict measure, trying to incorporate variations between fields of study but also requiring that publications should be refereed or in some other way “accepted”. This means that some projects with submitted (but not yet accepted) papers have lower “scores” than they otherwise might. It also ignores the direct value of the data to the team and to other researchers, which is pretty punishing for projects like Old Weather where the data itself is the main output. And much of the huge variety in other Old Weather outputs wasn’t captured by our metric. If it had been, the “Contribution to Science” score would have been higher.
Secondly, this matrix tends to favor projects that have a large and reasonably well-engaged user base. Projects with a higher number of volunteers have a higher score, and projects where the distribution of work is more evenly spread also have a higher score. This means that projects where a very large fraction of the work is done by a smaller group of loyal followers are at a bit of a disadvantage by these measurements. Choosing a sweet spot in the tradeoff between broad and deep engagement is a tricky task. Old Weather has focused on, and delivered, some of the deepest engagement of all our projects, which meant these measures didn’t do it justice.
To give a quantitative example: the distribution of work is measured by the Gini coefficient (on a scale of 0 to 1), and in our metric lower numbers, i.e. more even distributions, are better. The 3 highest Gini coefficients in the projects we examined were Old Weather (0.95), Planet Hunters (0.93), and Bat Detective (0.91); the average Gini coefficient across all projects was 0.82. It seems clear that a future version of the success matrix should incorporate a more complex use of this measure, as very successful projects can have high Gini coefficients (which is another way of saying that a loyal following is often a highly desirable component of a successful citizen science project).
Thirdly, I mentioned in part 1 that these measures of the Old Weather classifications were from the version of the project that launched in 2012. That means that, unlike every other project studied, Old Weather’s measures don’t capture the surge of popularity it had in its initial stages. To understand why that might make a huge difference, it helps to compare it to the only eligible project that isn’t shown on the matrix above: The Andromeda Project.
In contrast to Old Weather, The Andromeda Project had a very short duration: it collected classifications for about 4 weeks total, divided over 2 project data releases. It was wildly popular, so much so that the project never had a chance to settle in for the long haul. A typical Zooniverse project has a burst of initial activity followed by a “long tail” of sustained classifications and public engagement at a much lower level than the initial phase.
The Andromeda Project is an exception to all the other projects because its measures are only from the initial surge. If we were to plot the success matrix including The Andromeda Project in the normalizations, the plot looks like this:
And this study was done before the project’s first paper was accepted, which it has now been. If we included that, The Andromeda Project’s position would be even further to the right as well.
Because we try to control for project duration, the very short duration of the Andromeda Project means it gets a big boost. Thus it’s a bit unfair to compare all the other projects to The Andromeda Project, because the data isn’t quite the same.
However, that’s also true of Old Weather — but instead of only capturing the initial surge, our measurements for Old Weather omit it. These measurements only capture the “slow and steady” part of the classification activity, where the most faithful members contribute enormously but where our metrics aren’t necessarily optimized. That unfairly makes Old Weather look like it’s not doing as well.
In fact, comparing these 2 projects has made us realize that projects probably move around significantly in this diagram as they evolve. Old Weather’s other successes aren’t fully captured by our metrics anyway, and we should keep those imperfections and caveats in mind when we apply this or any other success measure to citizen science projects in the future; but one of the other things I’d really like to see in the future is a study of how a successful project can expect to evolve across this matrix over its life span.
Why do astronomy projects do so well?
There are multiple explanations for why astronomy projects seem to preferentially occupy the upper-right quadrant of the matrix. First, the Zooniverse was founded by astronomers and still has a high percentage of astronomers or ex-astronomers on the payroll. For many team members, astronomy is in our wheelhouse, and it’s likely this has affected decisions at every level of the Zooniverse, from project selection to project design. That’s starting to change as we diversify into other fields and recruit much-needed expertise in, for example, ecology and the humanities. We’ve also launched the new project builder, which means we no longer filter the list of potential projects: anyone can build a project on the Zooniverse platform. So I think we can expect the types of projects appearing in the top-right of the matrix to broaden considerably in the next few years.
The second reason astronomy seems to do well is just time. Galaxy Zoo 1 is the first and oldest project (in fact, it pre-dates the Zooniverse itself), and all the other Galaxy Zoo versions were more like continuations, so they hit the ground running because the science team didn’t have a steep learning curve. In part because the early Zooniverse was astronomer-dominated, many of the earliest Zooniverse projects were astronomy related, and they’ve just had more time to do more with their big datasets. More publications, more citations, more blog posts, and so on. We try to control for project age and duration in our analysis, but it’s possible there are some residual advantages to having extra years to work with a project’s results.
Moreover, those early astronomy projects might have gotten an additional boost from each other: they were more likely to be popular with the established Zooniverse community, compared to similarly early non-astronomy projects which may not have had such a clear overlap with the established Zoo volunteers’ interests.
Summary
The citizen science project success matrix presented in Cox et al. (2015) is the first time such a diverse array of project measures have been combined into a single matrix for assessing the performance of citizen science projects. We learned during this study that public engagement is well worth the effort for research teams, as projects that do well at public engagement also make better contributions to science.
It’s also true that this matrix, like any system that tries to distill such a complex issue into a single measure, is imperfect. There are several ways we can improve the matrix in the future, but for now, used mindfully (and noting clear exceptions), this is generally a useful way to assess the health of a citizen science project like those we have in the Zooniverse.
What makes one citizen science project flourish while another flounders? Is there a foolproof recipe for success when creating a citizen science project? As part of building and helping others build projects that ask the public to contribute to diverse research goals, we think and talk a lot about success and failure at the Zooniverse.
But while our individual definitions of success overlap quite a bit, we don’t all agree on which factors are the most important. Our opinions are informed by years of experience, yet before this year we hadn’t tried incorporating our data into a comprehensive set of measures — or “metrics”. So when our collaborators in the VOLCROWE project proposed that we try to quantify success in the Zooniverse using a wide variety of measures, we jumped at the chance. We knew it would be a challenge, and we also knew we probably wouldn’t be able to find a single set of metrics suitable for all projects, but we figured we should at least try to write down onepossible approach and note its strengths and weaknesses so that others might be able to build on our ideas.
In this study, we only considered projects that were at least 18 months old, so that all the projects considered had a minimum amount of time to analyze their data and publish their work. For a few of our earliest projects, we weren’t able to source the raw classification data and/or get the public-engagement data we needed, so those projects were excluded from the analysis. We ended up with a case study of 17 projects in all (plus the Andromeda Project, about which more in part 2).
In late July I led a week-long course about crowdsourcing and data visualization at the Digital Humanities Oxford Summer School. I taught the crowdsourcing part, while my friend and collaborator, Sarah, from Google, lead the data visualization part. We had six participants from fields as diverse as history, archeology, botany and literature, to museum and library curation. Everyone brought a small batch of images, and used the new Zooniverse Project Builder (“Panoptes”) to create their own projects. We asked participants what were their most pressing research questions? If the dataset were larger, why would crowdsourcing be an appropriate methodology, instead of doing the tasks themselves? What would interest the crowd most? What string of questions or tasks might render the best data to work with later in the week?
Within two days everyone had a project up and running. We experienced some teething problems along the way (Panoptes is still in active development) but we got there in the end! Everyone’s project looked swish, if you ask me.
Participants had to ‘sell’ their projects in person and on social media to attract a crowd. The rates of participation were pretty impressive for a 24-hour sprint. Several hundred classifications were contributed, which gave each project owner enough data to work with.
But of course, a good looking website and good participation rates do not equate to easy-to-use or even good data! Several of us found that overly complex marking tasks rendered very convoluted data and clearly lost people’s attention. After working at the Zooniverse for over a year I knew this by rote, but I’d never really had the experience of setting up a workflow and seeing what came out in such a tangible way.
Despite the variable data, everyone was able to do something interesting with their results. The archeologist working on pottery shards investigated whether there was a correlation between clay color and decoration. Clay is regional, but are decorative fashions regional or do they travel? He found, to his surprise, that they were widespread.
In the end, everyone agreed that they would create simpler projects next time around. Our urge to catalogue and describe everything about an object—a natural result of our training in the humanities and GLAM sectors—has to be reined in when designing a crowdsourcing project. On the other hand, our ability to tell stories, and this particular group’s willingness to get to grips with quantitative results, points to a future where humanities specialists use crowdsourcing and quantitative methods to open up their research in new and exciting ways.
-Victoria, humanities project lead
The world's largest and most popular platform for people-powered research. This research is made possible by volunteers—millions of people around the world who come together to assist professional researchers.