Tag Archives: data

Zooniverse Workflow Bug

We recently uncovered a couple of bugs in the Zooniverse code which meant that the wrong question text may have been shown to some volunteers on Zooniverse projects while they were classifying. They were caught and a fix was released the same day on 29th November 2018.

The bugs only affected some projects with multiple live workflows from 6th-12th and 20th-29th November.

One of the bugs was difficult to recreate and relied on a complex timing of events, therefore we think it was rare and probably did not affect a significant fraction of classifications, so it hopefully will not have caused major issues with the general consensus on the data. However, it is not possible for us to say exactly which classifications were affected in the timeframe the bug was active.

We have apologised to the relevant science teams for the issues this may cause with their data analysis, but we would also like to extend our apologies to all volunteers who have taken part in these projects during the time the bugs were in effect. It is of the utmost importance to us that no effort is wasted on our projects and when something like this happens it is taken very seriously by the Zooniverse team. Since we discovered these bugs we worked tirelessly to fix them, and we have taken actions to make sure nothing like this will happen in the future.

We hope that you accept our most sincere apologies and continue the amazing work you do on the Zooniverse. If you have any questions please don’t hesitate to contact us at contact@zooniverse.org.

Sincerely,

The Zooniverse Team

Stargazing Live: The Results Are In

IMG_1172
The Lovell Telescope observing 9io9: a candidate lens spotted by volunteers on Space Warps.

BBC Stargazing Live 2014 has been asking people to visit the Zooniverse’s Space Warps site to identify gravitational lenses: extremely rare events caused by one galaxy passing in front of another (very distant) galaxy. Tens of thousands of you have taken part and classified more than 6.5 million images.

Your classifications have already led to the discovery of more than 50 potential gravitational lenses! Amongst them are several beautiful and interesting discoveries. You can see a few of our favourite candidates above. For Stargazing Live’s third and final show we have focussed on the spectacular red arc/ring shown below, it has been nicknamed 9io9 by the team right now, because of it’s Zooniverse ID. You can see more of what our volunteers are saying about it here on Talk.

Credit: Jim Geach / VICS82

The Space Warps team have produced a model of it and currently think the background (red) galaxy is at redshift of about 2, which means the light has taken more than 10 billion years to reach us! You can see the comparison of the model and the data below. There’s a chance it could be further away but we’ll keep you posted. The nearer object (white/yellow) is about 2 billion light years away and has a mass of 100 billion times that of our Sun – which makes it about the same size as our own galaxy.

Model_and_Data_Credit_A_More
Comparison of the model (left) and real (right) data.

We know all this because we have spent the last 24 hours calling in every favour we have worldwide. The Space Warps science team, and various Zooniverse scientists from other projects, have been literally asking favours from people using the world’s biggest telescopes. We were even able to get some time on the massive Keck telescope in Hawai’i, where astronomers were having to break ice off the dome to get data. Astronomers love a good challenge!

Of course Stargazing Live is filmed at Jodrell Bank, home to one of the world’s largest radio dishes: the Lovell Telescope. This candidate lens is perfect for a radio observation – which can tell us more about its mass and position in space – and I’m excited to say that the giant dish is observing the target as I write!

Space Warps has been a huge success over the past three days and the project continues! Every classification on Space Warps helps our computers understand the whole data set, and so in a way all the objects discovered on Space Warps are the result of everybody’s combined work. You can keep up to date with news from Space Warp via the project’s blog, Twitter and Facebook sites.

A huge thank you to the BBC crew, the Jodrell Bank team, the Space Warps scientists, developers and moderators, and to everyone that took part this week. Keep clicking!

ZooTools: Going Deeper With Zooniverse Project Data

One of the best things about being an educator on the Zooniverse development team is the opportunity to interact with teachers who are using Zooniverse projects in their classroom and teachers who are interested in using Zooniverse projects in the classroom. Teachers cite several reasons about why they use these projects – Authentic data?  Check. Contributing to cutting-edge research across a variety of scientific fields?  Check.  Free?  Check. Classifying a few galaxies in Galaxy Zoo or identifying and measuring some plankton in Plankton Portal can be an exciting introduction to participating in scientific investigations with “the professionals.”  This isn’t enough though; teachers and other educators are hungry for ways to facilitate deeper student engagement with scientific data. Zooniverse educators and developers are consistently asked “How can my students dig deeper into the data on Zooniverse?”

This is where ZooTools comes into play. The Zooniverse development team has recently created ZooTools as a place where volunteers can observe, collect, and analyze data from Zooniverse citizen science projects. These tools were initially conceived as a toolkit for adult volunteers to use to make discoveries within Zooniverse data but it is becoming apparent that these would also have useful applications in formal education settings. It’s worth pointing out that these tools are currently in beta. In the world of web development beta basically means “it ain’t perfect yet.”  ZooTools is not polished and perfect; in fact it’s possible you may encounter some bugs.

Projects like Galaxy Zoo and Planet Hunters have an impressive history of “extra credit” discoveries made by volunteers.  Galaxy Zoo volunteers have made major contributions to the astronomy literature through the discovery of the green peas galaxies and Hanny’s Voorwerp .  In Planet Hunters volunteers use Talk to share methods of exploring and results from the project’s light curves.  ZooTools lowers the barrier of entry by equipping volunteers with some simple tools to look for interesting relationships and results contained within the data.  No specialist knowledge required.

We’ve only begun thinking about how ZooTools could be used in the classroom.  I started my own investigation with a question that came from a Zooniverse classroom visit from last spring.  While making observations as a class about some of the amazing animals in Snapshot Serengeti one young man asked about civets. He wanted to know If they were nocturnal. We had an interesting discussion about how you could find out this information.  The general consensus was to Google it or look it up on Wikipedia.  I wondered if you could use the data contained within Snapshot Serengeti to come up with a reasonable answer.  I was excited to roll-up my sleeves and figure out how to use these tools to find a likely answer.  Here are the steps I took…

Step 1: Log-in to Zooniverse and go to ZooTools.

Step 1

Step 2: Select a project. Currently only have a few projects have data available to explore using ZooTools.

Step 2

Step 3: Create a dashboard.

Step 3

Step 4: Name your dashboard something awesome. I called mine Civets! for obvious reasons.

Step 4

Step 5: This is your blank dashboard.

Step 5

Step 6: It’s time to select a data source. I selected Snapshot Serengeti.

Step 6

Step 7: This is the data source.

Step 7

Step 8: I wanted to be able to filter my data so I selected Filter under search type. The name of this dataset in Snapshot Serengeti 1.

Step 8

Step 9: Since I wanted to look at civets, I selected that on the species dropdown menu and then clicked Load Data. My dataset will only contain images that Snapshot Serengeti volunteers identified as civets.

Step 9

Step 10: I had my data; next it was time to select a Tool.  I selected Tools at the top of the page.

Step 10

Step 11: I selected Subject Viewer because this tool allows my to flip through different images.

Step 11

Step 12: Next I had to connect my data source to my tool. From the Data Source drop down menu I selected Snapshot Serengeti 1.

Step 12

Step 13: In order to get a good luck at the images in my dataset I clicked the icon shaped like a fork to close the pane.  I then used the arrows to advance through the images.

Step 13

I flipped through the images and kept track of the night versus day. Of the 37 images in my dataset, I observed that 34 were taken at night and 3 were taken during the day.  This led me to the conclusion that civets are likely nocturnal.  This was so much more satisfying than just going to Google or Wikipedia. A couple of other questions that I explored…

What is the distribution of animals identified at one camera trap site?

14


How many honeybadgers have been observed by Snapshot Serengeti volunteers across different camera traps?

Screen Shot 2013-11-26 at 3.17.28 PM

Of course this is just the tip of the iceberg.  Currently you can explore Galaxy Zoo, Space Warps, and Snapshot Serengeti data using ZooTools. Currently you can use ZooTools to explore data from Galaxy Zoo, Space Warps, and Snapshot Serengeti.  The specific tools and datasets available vary from project to project.  In Galaxy Zoo for example you can look at data from Galaxy Zoo classifications or from SDSS Skyserver. Hopefully you’ll be inspired to have a play with these tools!  What questions would you or your students like to explore?

Zoo Tools: A New Way to Analyze, View and Share Data

Since the very first days of Galaxy Zoo, our projects have seen amazing contributions from volunteers who have gone beyond the main classification tasks. Many of these examples have led to scientific publications, including Hanny’s Voorwerp, the ‘green pea’ galaxies, and the circumbinary planet PH1b.

One common thread that runs through the many positive experiences we’ve had with the volunteers is the way in which they’ve interacted more deeply with the data. In Galaxy Zoo, much of this has been enabled by linking to the Sloan SkyServer website, where you can find huge amounts of additional information about galaxies on the site (redshift, spectra, magnitudes, etc). We’ve put in similar links on other projects now, linking to the Kepler database on Planet Hunters, or data on the location and water conditions in Seafloor Explorer.

The second part of this that we think is really important, however, is providing ways in which users can actually use and manipulate this data. Some users have been already been very resourceful in developing their own analysis tools for Zooniverse projects, or have done lots of offline work pulling data into Excel, IDL, Python, and lots of other programs (see examples here and here). We want to make using the data easier and available to more of our community, which has led to the development of Zoo Tools (http://tools.zooniverse.org). Zoo Tools is still undergoing some development, but we’d like to start by describing what it can do and what sort of data is available.

An Example

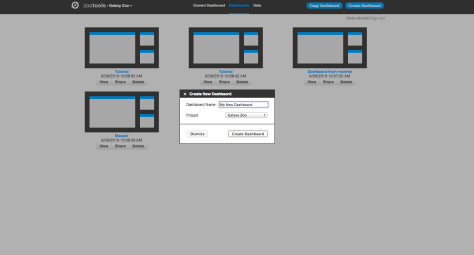
Zoo Tools works in an environment which we call the Dashboard – each Dashboard can be thought of as a separate project that you’re working on. You can create new Dashboards yourself, or work collaboratively with other people on the same Dashboard by sharing the URL.

Zoo Tools Main Page

Create a New Dashboard

Within the Dashboard, there are two main functions: selecting/importing data, and then using tools to analyze the data.

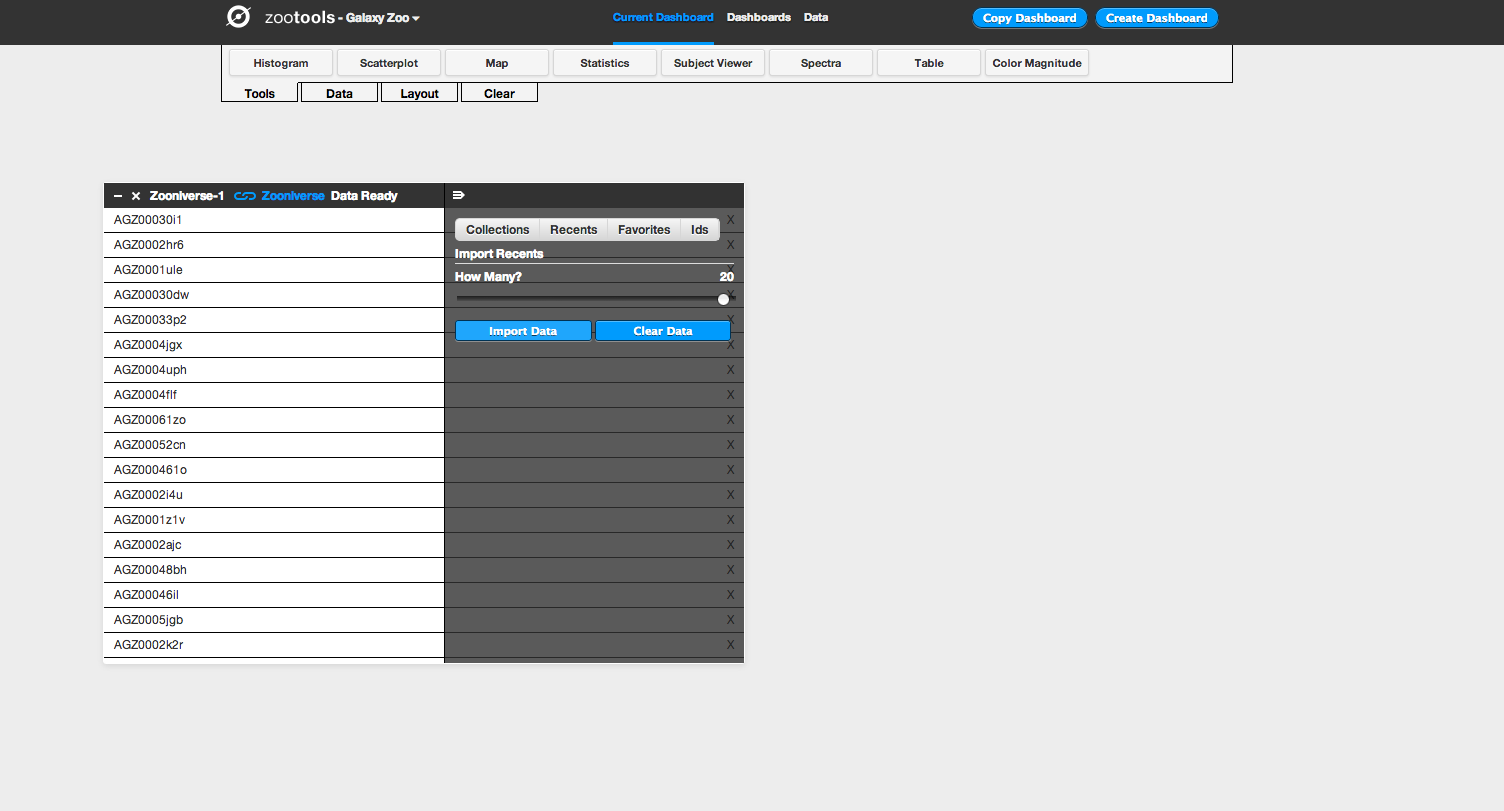
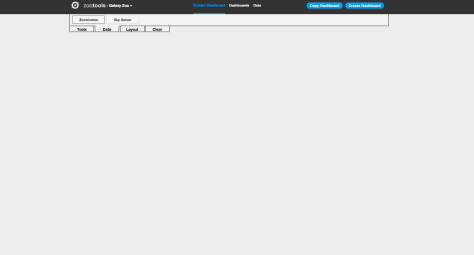
The first step for working with the Dashboard is to select the data you’d like to analyze. At the top left of the screen, there’s a tab named “Data”. If you click on this, you’ll see the different databases that Zoo Tools can query. For Galaxy Zoo, for example, it can query the Zooniverse database itself (galaxies that are currently being classified by the project), or you can also analyze other galaxies from the SDSS via their Sky Server website.

Import Data from Zooniverse

Clicking on the “Zooniverse” button, for example, you can select galaxies in one of four ways: a Collection (either your own or someone else’s), looking at your recently classified galaxies, galaxies that you’ve favorited, or specific galaxies via their Zooniverse IDs. Selecting any of these will import them as a dataset, which you can start to look at and analyze. In this example we’ll import 20 recent galaxies.

Import 20 Recents

After importing your dataset, you can use any of the tools in Dashboard (which you can select under “Tools” at the top of the page) on your data. After selecting a tool, you choose the dataset that you’d like to work with from a dropdown menu, and then you can begin using it. For example: if I want to look at the locations of my galaxies on the sky, I can select the “Map” tool. I then select the data source I’d like to plot (in this case, “Zooniverse–1”) and the tool plots the coordinates of each galaxy on a map of the sky. I can select different wavelength options for the background (visible light, infrared, radio, etc), and could potentially use this to analyze whether my galaxies are likely to have more stars nearby based on their position with respect to the Milky Way.

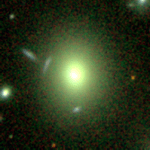
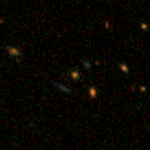
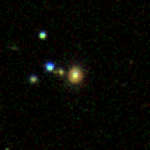
The other really useful part is that the tools can talk to each other, and can pass data back and forth. For example: you could import a collection of galaxies and look at their colour in a scatterplot. You could then select only certain galaxies in that tool, and then plot the positions of those galaxies on the map. This is what we do in the screenshots below:

This slideshow requires JavaScript.

Making Data Analysis Social

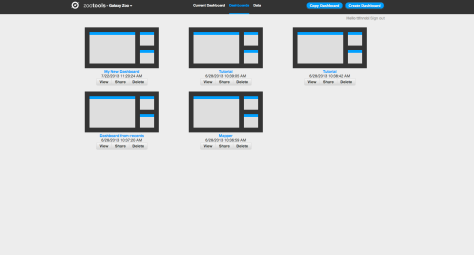
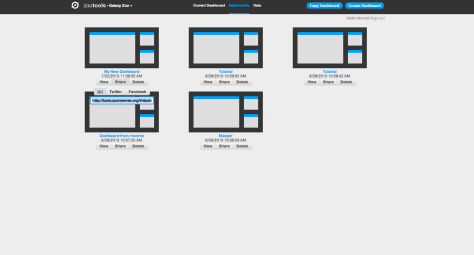
You can also share Dashboards with other people. From the Zoo Tools home page you can access your existing dashboards as well as delete them and share them with others. You can share on Twitter and Facebook or just grab the URL directly. For example, the Dashboard above can be found here – with a few more tools added as a demonstration.

Sharing a Dashboard

This means that once you have a Dashboard set up and ready to use, you can send it to somebody else to use too. Doing this will mean that they see the same tools in the same configuration, but on their own account. They can then either replicate or verify your work – or branch off and use what you were doing as a springboard for something new.

What ‘Tools’ Are There?

Currently, there are eight tools available for both regular Galaxy Zoo and the Galaxy Zoo Quench projects:

  • Histogram: makes bar charts of a single data parameter
  • Scatterplot: plot any two data parameters against each other
  • Map: plot the position of objects on the sky, overplotted on maps of the sky at different wavelengths (radio, visible, X-ray, etc.)
  • Statistics: compute some of the most common statistics on your data (eg, mean, minimum, maximum, etc).
  • Subject viewer: examine individual objects, including both the image and all the metadata associated with that object
  • Spectra: for galaxies in the SDSS with a spectrum, download and examine the spectrum.
  • Table: List the metadata for all objects in a dataset. You can also use this tool to create new columns from the data that exists – for example, take the difference between magnitudes to define the color of a galaxy.
  • Color-magnitude: look at how the color and magnitude of galaxies compare to the total population of Galaxy Zoo. A really nice way of visualizing and analyzing how unusual a particular galaxy might be.

We have one tool up and running for Space Warps called Space Warp Viewer. This lets users adjust the color and scale parameters of image to examine potential gravitational lenses in more detail.

Snapshot Serengeti Dashboard

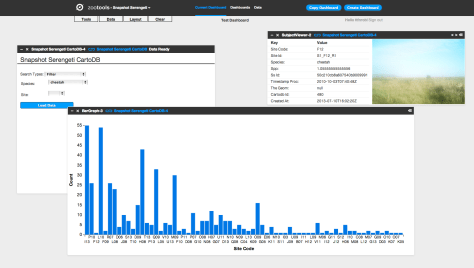
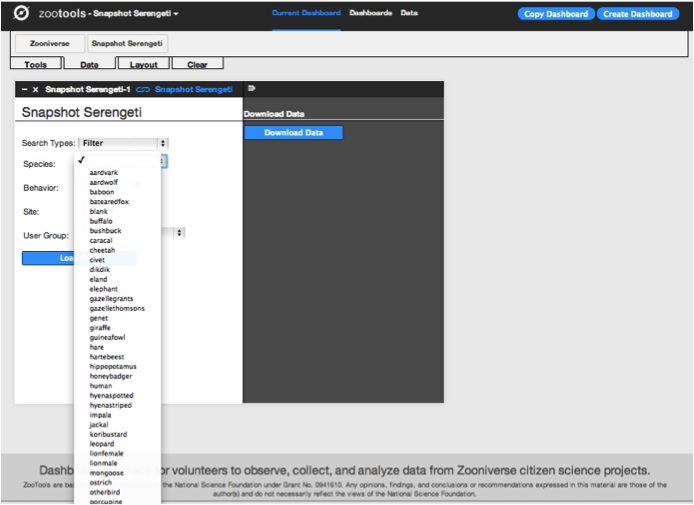
Finally, Snapshot Serengeti has several of the same tools that Galaxy Zoo does, including Statistics, Subject Viewer, Table, and Histogram (aka Bar Graph). There’s also Image Gallery, where you can examine the still images from your datasets, and we’re working on an Image Player. There’s a few very cool and advanced tools we started developing last week – they’re not yet deployed, but we’re really excited to let you follow the activity over many seasons or by focusing on particular cameras. Stay tuned. You can see an example Serengeti Dashboard, showing the distribution of Cheetahs, here (it’s also shown in the screenshot above).

We hope that Zoo Tools will be an important part of all Zooniverse projects in the future, and we’re looking forward to you trying them out. More to come soon!