Guest post from Eilidh O’Brien, Staff Scientist, Whales of Iceland Museum
Appropriately located in Reykjavík’s harbour district, Whales of Iceland is the largest museum dedicated to cetaceans in Europe. Much of the space inside is dedicated to life-sized models of the 23 species of whales, dolphins and porpoises that have been sighted in the waters around Iceland throughout history, some very common while others are very rare. When the museum was founded these models were the main focus of the exhibition: a chance for visitors to experience the true size of these gigantic marine animals, and to learn a little about each of the species on display. However, this focus is now evolving and Zooniverse is set to play an important part.
Iceland is a hotspot for cetaceans – and so, also for cetacean researchers! Some remarkable discoveries have been made here in the last decade, from the first recordings of humpback whales singing in their feeding grounds over winter, to the unusual antagonistic interactions between killer whales and long-finned pilot whales. We want to highlight this at Whales of Iceland so that our museum is not just a place to learn about cetaceans themselves, but also how scientists study these fascinating and complex animals, what this research has uncovered, and all the things that we still do not know!
In addition to learning about the research happening here in Iceland, we want to give visitors the opportunity to take part in some real scientific projects. So, thanks to Zooniverse, our newest exhibit will include a citizen science station where anyone can have a shot at being a scientist! We will feature a range of Zooniverse projects for visitors to choose from, giving them a variety of different marine mammal species and different aspects of wildlife ecology to learn about.
Our aim is to make Whales of Iceland a more interactive and thought-provoking experience. We hope that our museum will continue to offer visitors the chance to marvel at the size and beauty of these wonderful creatures, but also to engage with the natural world in ways they may not have before, and to feel that they have not just learned, but discovered.
This collaboration is still in its early stages. With the green light from Zooniverse Co-PI Dr. Laura Trouille, we have already launched a scaled-down version of what we hope the final exhibit will be, and it has been a really promising success! Museums provide a perfect platform for citizen science; we are a small museum relatively speaking, but our footfall in peak season can be more than 400 people in a day. That’s a lot of potential citizen scientists! In ecology, we would call this a mutualistic symbiosis – or, in other words, everyone wins! Our museum guests can provide valuable contributions to scientific projects all over the world, while at the same time gaining first-hand insight into the life of a whale researcher.
We are so excited to develop and expand our collaboration with Zooniverse, as well as other citizen science initiatives. Our finished research exhibit will be unveiled very soon – watch this space!
By Tasnova, Guest Writer and Adler Zooniverse Summer ’22 Teen Intern
This summer, I worked as an intern for the Adler Planetarium in Chicago, alongside Lola Fash and Dylan. As a group, we carried out Zooniverse projects and interviews with the researchers leading them. In this blog post, I will share about my experience with the main project that I took part in: Transcribe Colored Conventions.
In July 2022 I interviewed Dr. Jim Casey and Justin Smith, two of the research leads for the Colored Conventions project with Zooniverse. Dr. Casey is an assistant research professor of African American Studies at Penn State University, managing director of the Center for Black Digital Research, and co-founder for the Colored Conventions project. Justin Smith is a Ph.D. candidate in English and African American studies at Penn State and a member of the Douglass Day team.
Before I dig into what the Colored Conventions were, I’d like to share my own experience while working on these projects. I chose to focus on Transcribe Colored Convention because I am a huge history lover. I want to learn everything; learning feeds my curiosity. I was really excited to learn about the Colored Conventions since they are often neglected in textbooks; my school never taught me about the Colored Conventions. It was my first time learning anything about the Colored Conventions. I was so excited to get to interview the amazing people leading the Zooniverse project to transcribe documents related to the Colored Conventions.
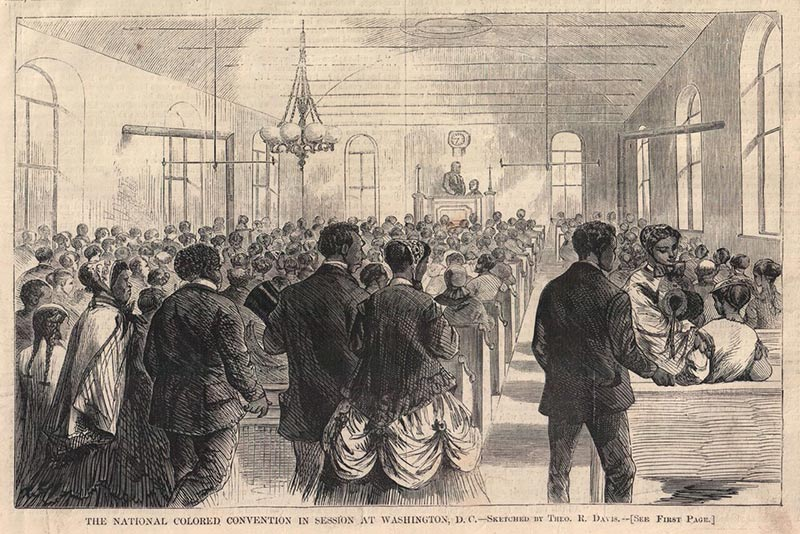
The Colored Conventions were events that took place during the nineteenth century and spread across 34 states. In these Conventions, the participants talked about how they could get access to voting rights, education, labor, and business.
However, despite how important they were, no one really talks about the Colored Conventions today. It is incredibly sad for me to see this important part of our history being neglected.
Another interesting aspect about the Colored Conventions that I learned about through interviewing the team is that the documents related to the Conventions were very male dominated. What this means is that while men’s efforts were well documented in the Conventions’ archive, women’s efforts were not. For example, of the names initially identified and highlighted in the documents, 98% belong to men.
An early researcher who recognized women’s contributions to the Colored Conventions is Dr. Psyche William Foresham, a University of Maryland professor who wrote the essay “What Did They Eat? Where Did They Stay?” In the essay she talked about how women organized restaurants and boarding houses for the people who traveled from other states to join the Convention meeting. They also financially supported them. The essay was eye opening for other researchers, and prompted them to read the Conventions’ documents more carefully to find references to women that might have been overlooked. As a result of these efforts, they found more references to women in the Convention documents.
Zooniverse volunteers also helped transcribe the Colored Convention documents, further unlocking the data for the researchers. The researchers were thrilled to see so many people actually participating in transcribing the documents and caring deeply about the project. The volunteers transcription efforts also uncovered additional evidence of references to women’s efforts in the Colored Convention documents. In my own journey learning about this project, I was happily surprised to see that so many people participated in transcribing the documents and cared about this piece of history that was neglected for so long.
Here are some clips from the full recording of my interview with Dr. Jim Casey and Justin Smith.
A few final thoughts: When I was interviewing the researchers, I loved seeing how passionate they were. It feels rare to talk with people who are passionate about their work. If I see someone who is really passionate about their work and the effort they put in, it’s incredibly motivating. I hope to feel the same in my career.
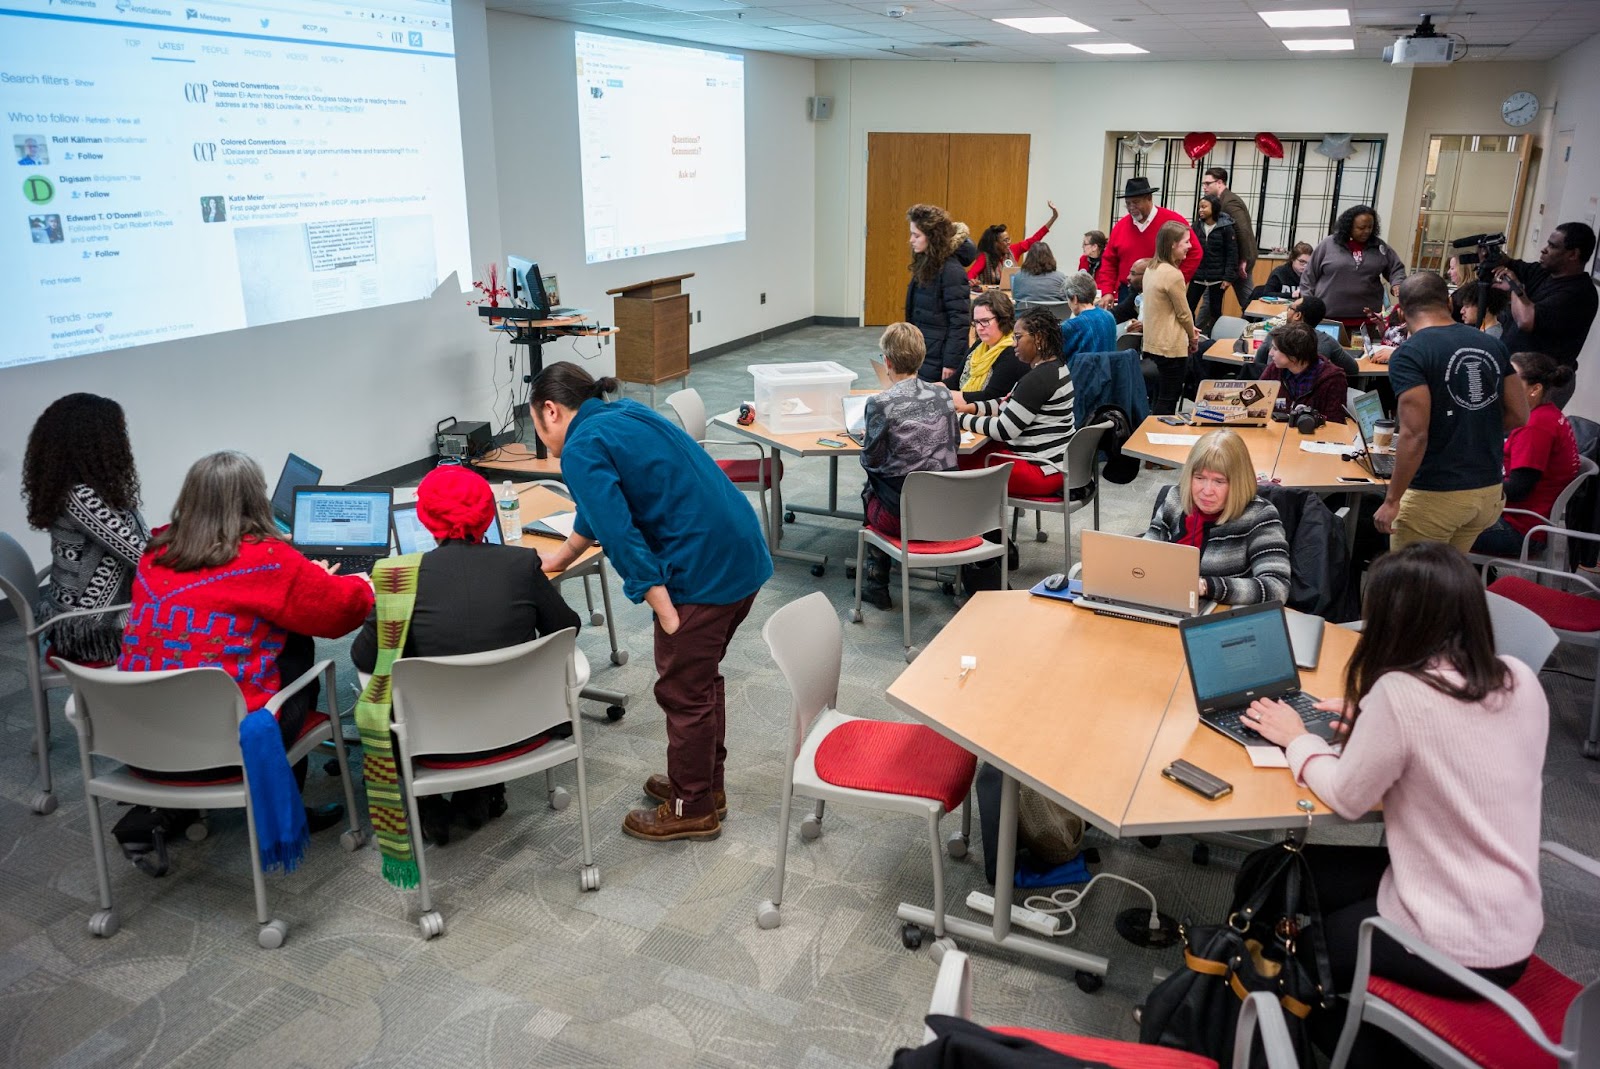
Colored Convention Project team helping the volunteers during the Transcribe-a-Thon. Credit: Dr. Jim Casey
During my interview, I was nervous in the beginning because this was my first time interviewing a researcher, or anyone. My hands and feet were cold. I tried to calm myself down so I wouldn’t stutter. I think I did a good job interviewing them. My mentor, Sean (who is the Zooniverse designer at Adler), helped me a lot in preparing for the interview. He helped me see that the pressure is not on me as an interviewer; instead, the pressure is on the interviewees because they need to answer the questions. I think that really helped me to calm down because I kept saying to myself that “the pressure is on them, not me.” And my interviewees were such nice people too! I was proud of myself for how I carried out the interview.
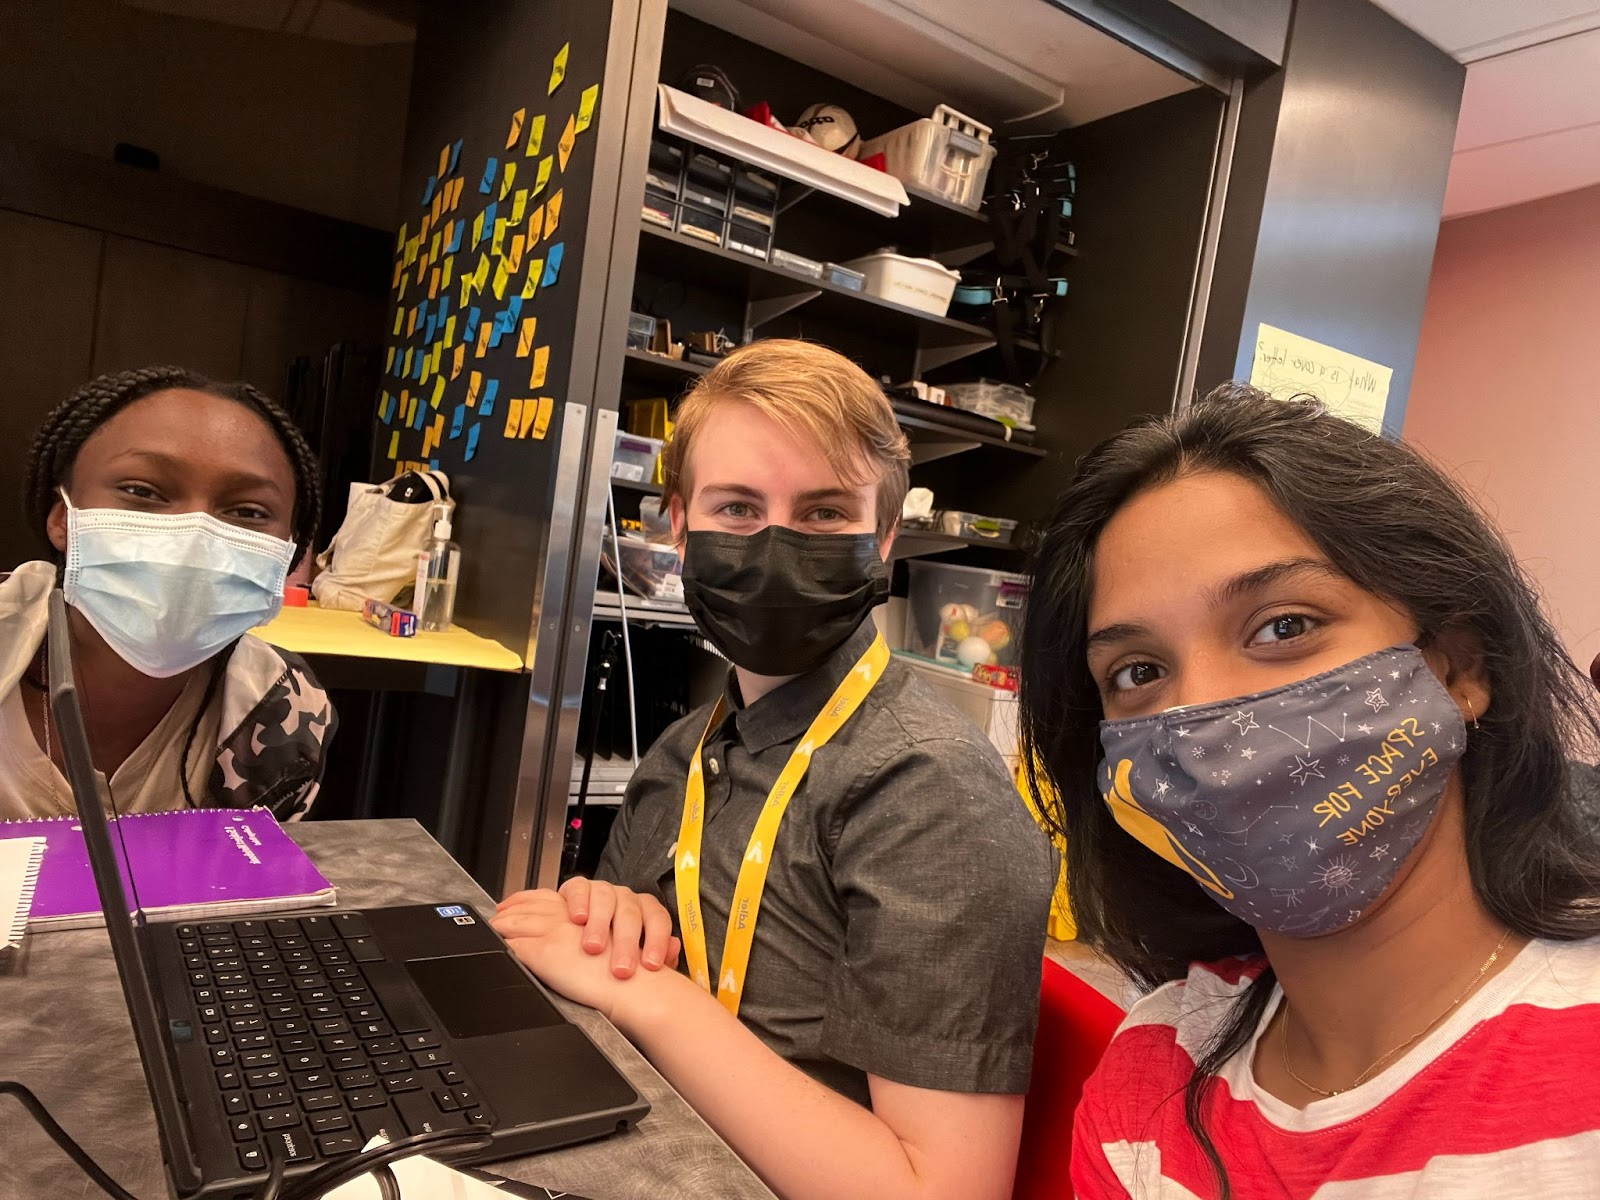
Last, but not least, thank you to my teammates Dylan and Lola Fash for helping me out with my summary, video editing, and my blog.
These are my Zooniverse intern colleagues. They helped me with every single challenge in my internship. Photo credit: Tasnova]
By Dylan, Guest Writer and Adler Zooniverse Summer ’22 Teen Intern
Every once in a while, you get an opportunity that’s so cool, you sort of can’t believe that it’s happening. When I was told that I would have the chance to interview Dr. Colin Orion Chandler, a (then) grad student at Northern Arizona University, who is responsible for creating and leading the Active Asteroids project on Zooniverse, I was beyond thrilled. Every year, the Adler Planetarium in Chicago hires several interns to fill a variety of placements around the museum. As Zooniverse interns, Lola Fash, Tasnova, and I got to interview several researchers on three different projects: Transcribe Colored Conventions, NASA GLOBE Cloud Gaze, and my focus, Active Asteroids.
What are active asteroids, and why should we care?
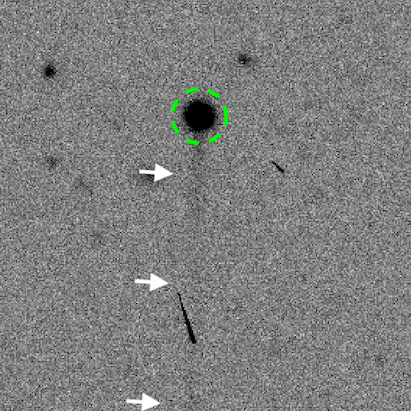
An active asteroid pictured on the Active Asteroids project About page, on the Zooniverse website. The green circle shows where a coma would appear, and the white arrows point to the tail of the asteroid. (Photo Credit: Zooniverse)
Active asteroids are bodies that follow a typical orbit for an asteroid, but, when observed, they are seen to have comae, which are clouds around the object, and tails, which form when water, dry ice, or dust streak out behind the object. These bizarre objects are extremely rare, so we don’t know much about them, but their tails and comae lead researchers to believe that they might have water on them. According to Dr. Chandler, “Water gives us fuel power. Things that we need to drink, to live, gives us things to breathe. It lets us grow food. I mean, it does a huge number of things. But you have to actually know where you might find it and how hard it is to get out of there.”
The hunt for active asteroids
Studying active asteroids could yield remarkable amounts of scientific information, but they are so faint that scientists have trouble finding them. However, the Dark Energy Camera in Chile is sensitive enough to photograph these asteroids, and it sometimes catches an asteroid in part of an image when it was photographing a different object altogether.
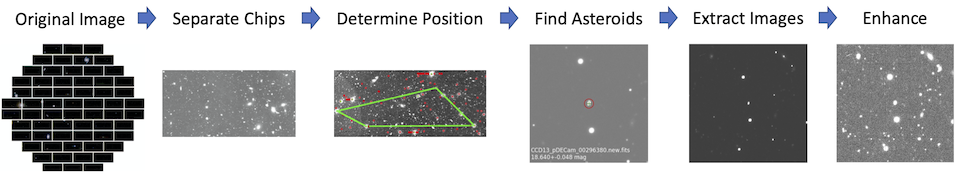
To get data from these archived images, Dr. Chandler and his team break the images into chips, cut out the asteroid, and then focus and enhance the image so that, if there is a tail, we will be able to see it. Will Burris, one of Dr. Chandler’s students, has helped streamline this process. All of these steps have been automated so that computers can process the nearly 30 million images that could contain active objects, and narrow it down to about 10 million where the objects are most likely to appear.
The image above demonstrates the process by which the Active Asteroids team finds images of potential active asteroids before they pass the images along to volunteers who can better identify them. (Photo Credit: Zooniverse)
The next step in the process is to identify whether or not there is a tail or coma around the object in the image, and that’s where volunteers come in. Computers are unable to identify active asteroids with a reasonable degree of accuracy, so the task falls to human minds. But, because of the sheer volume of images, Dr. Chandler and his team are unable to process them on their own. Instead, they harness the power of the crowd to classify these images for them, so they can process the data in a reasonable amount of time. When we spoke, Dr. Chandler explained why he opted to go this route, and why he chose to use Zooniverse specifically, stating that, without Zooniverse “It [Active Asteroids] wouldn’t have been as successful, not even by a fraction.”
Once Zooniverse volunteers have fully sorted the data, Dr. Chandler and his team examine the results and single out promising candidates that should be followed up on later with different telescopes. William Oldroyd, in particular, helps with this process. One improvement he’s looking to make is discarding feedback from overly optimistic citizens. Some citizens flag far more asteroids as active than what truly exists, which can throw off the data collected by the Active Asteroids team. The observation and analysis team hopes that they will be able to separate these overly optimistic classifications from the rest, so that they can improve the accuracy of the data that comes in.
With a complete dataset, Dr. Chandler as well as his project co-founder, Jay Kueny, and their chief science advisor, Chad Trujillo, examine the results. If an object was flagged as active, they follow up in one of two ways; direct observation and archival research.
Studying active asteroids
Pointing a telescope directly at a candidate active asteroid to look for more signs of activity seems like the most obvious way to confirm whether or not it is active. However, this is often difficult for several reasons.
For one, many candidates are so faint that it can be difficult for even the most advanced telescopes, such as the James Webb Space Telescope, to pick them up.
For another, they can only be observed at certain times in their orbits, and those intervals are usually years apart. Even if an asteroid is visible, it might not be active at that time, since there are many different reasons that an asteroid becomes active, and they each result in different patterns in activity. In an impact event, activity is temporary and only associated with the collision. Likewise, in the event of a rotational breakup, which occurs when an asteroid spins too quickly and falls apart as a result, an asteroid will only have activity corresponding with breakup events.
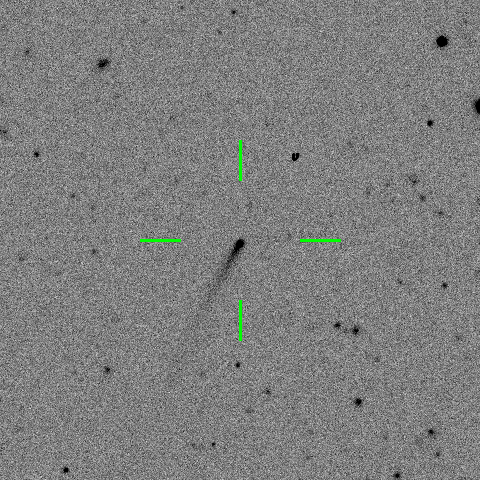
The image is one that volunteers classified on Active Asteroids. This object has already been confirmed as active. However, if one were to look at it with a telescope right now, it might not currently have a tail, or it might not be visible at all. (Image Credit: Zooniverse)
The asteroids that are most likely to show repeated activity are asteroids that are active due to sublimation, a process in which, as the asteroid gets closer to the Sun, the frozen carbon dioxide and water on its surface turn into gas and form a coma and tail behind it. Although this is a recurring event, a formerly active asteroid will not always be sublimating, so even if it can be observed, activity might not be detected.
For all of these reasons, when an object is identified as a promising candidate for activity, researchers prefer to follow up by looking through archived images that contain that object. When we talked, Dr. Chandler referred to “archival investigations” as “instant gratification” since he did not have to deal with the limitations of direct observation, and he could immediately confirm activity and further investigate the object by using images that were already taken.
Dr. Chandler and his team have already used the results from Active Asteroids to find and study several promising objects, and they are in the process of publishing their findings.
Reflections on my experience
All in all, working as a Zooniverse intern and learning about Active Asteroids has been an amazing experience. Going into the interview, I was worried that Dr. Chandler would be unapproachable and difficult to talk to. However, he seemed more than happy to discuss his work with me, and we actually talked well beyond the time when I’d originally expected the interview to stop. We were able to talk not just about Active Asteroids, but also what it’s like to be an LGBTQ+ person pursuing a career in science. As a young trans person, I often feel like I lack a connection with adults in my community, so getting to talk to someone with an identity similar to mine who was successfully pursuing a career in the field I aspire to join was an incredibly powerful experience. I wish I had a larger word count and some more time since I feel like I could probably write a whole book on interning at the Adler Planetarium and studying the Active Asteroids project on Zooniverse.
When I originally heard about active asteroids, I was mildly intrigued, but not all that excited about writing about them. Although I love all things space related, six months ago I would have said that asteroids are just about the most boring thing in space. However, after having done this project, I’ve become enthralled by active asteroids, and small planetary bodies in general. The idea of all the smaller rocks, tumbling through strange orbits in all kinds of places around the Sun, some with water or other invaluable resources that we may never even find, has found a special place in my heart. I hope this blog post has given you a piece of that.
By Lola Fash, Guest Writer and Adler Zooniverse Summer ’22 Teen Intern
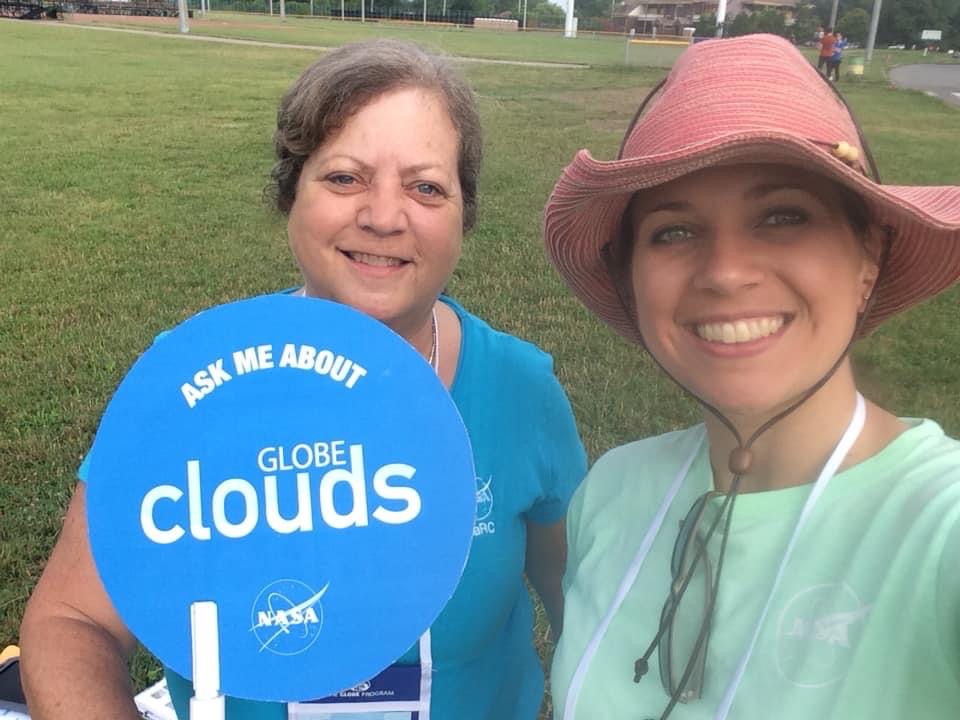
This summer I had the opportunity to be a Zooniverse intern at the Adler Planetarium in Chicago, with two other interns, Tasnova and Dylan. As a group, we carried out a series of interviews with researchers leading Zooniverse projects. My focus project was the NASA GLOBE Cloud Gaze on Zooniverse. I led the interview with NASA scientist Marilé Colón Robles, the principal investigator for the project, and Tina Rogerson, the co-investigator and data analyst for the project.
Marilé Colón Robles (right) and Tina Rogerson (left) outdoors working on GLOBE Clouds. Photo Credit: Tina Rogerson.
NASA GLOBE Cloud Gaze is a collaboration between the Global Learning and Observations to Benefit the Environment (GLOBE) Program, NASA’s largest citizen science program, and Zooniverse. When NASA began to study clouds to understand how they affect our climate, they launched about 20 satellites to collect data on Earth’s clouds. Unfortunately, these satellites are limited to only collecting data from above the clouds, which only paints half of the picture for scientists. They needed data from the ground to complete the picture. In 2018, they launched the first ever cloud challenge on GLOBE Clouds, which asked people all over the world to submit observations of clouds and photographs of their sky through the GLOBE Observer app. People responded faster than expected, submitting over 50,000 observations across 99 different countries during the month-long challenge. Because of the high volume, it would take months for researchers alone to go through each submission. So instead, they sought help, thus birthing the Zooniverse CLOUD GAZE project, where people help them classify these photos. Zooniverse participants classify the photos by cloud cover (what percent of the sky is covered by clouds), what type of cloud is in the image, and if they see any other conditions like haze, fog, or dust.
Why are clouds so important?
We see the immediate effects of these clouds in our atmosphere. For example, when you go out on a sunny day and the sun gets blocked by low altitude clouds, you feel cooler right away. But rather than looking at short-term effects, the CLOUD GAZE project is working to understand the long-term role clouds play on our climate.
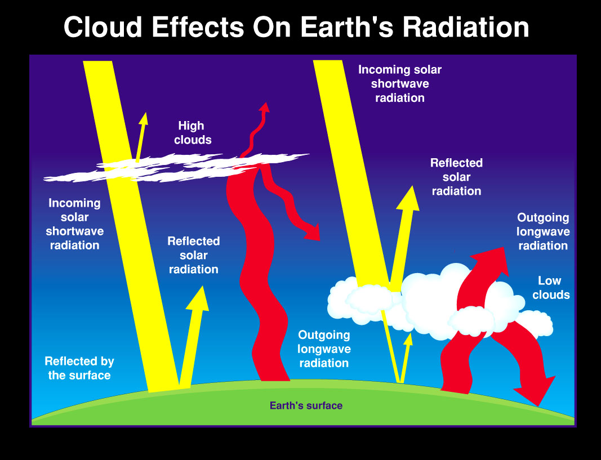
Clouds play a significant role in maintaining Earth’s climate. They control Earth’s energy budget, the balance between the energy the Earth receives from the Sun and the energy the Earth loses back into outer space, which determines Earth’s temperature. The effects clouds have varies by type, size, and altitude.
Credit: NASA GLOBE CLOUD GAZE
Cirrus, cirrostratus, and cirrocumulus clouds are high altitude clouds that allow incoming radiation to be absorbed by Earth, then trap it there, acting like an insulator and increasing Earth’s temperature. Low altitude clouds, such as stratus and cumulonimbus, keep our planet from absorbing incoming radiation, and allow it to radiate energy back into space.
The classifications made by Zooniverse participants are needed to determine the amount of solar radiation that is reflected or absorbed by clouds before reaching the surface of Earth and how that correlates to climate over time.
In my interview, I had the honor to meet with NASA Scientists Marilé Colón Robles and Tina Rogerson, learn more about the NASA GLOBE Cloud Gaze effort, and hear their predictions for the future.
Clip 1: Introductions
This first clip is of Marilé, Tina, and me introducing ourselves to one another. Note: The other participants you’ll see in the recordings are Sean Miller (Zooniverse designer and awesome mentor for us interns) and Dylan and Tasnova (my fellow interns).
Clip 2: What prompted you to start NASA GLOBE Cloud Gaze on Zooniverse?
Quote from Tina from this Clip 2: “We have 1.8 million photographs of the sky. We want to know what’s in those photographs.”
Clip 3: What have your GLOBE participants been telling you about what they’re seeing in their local environments about the impacts of climate change?
What are your hopes and goals for this project?
In the interview, I asked them about their hopes and broader goals for the project. They talked about how in order to really understand climate change, we need to gather the best data possible. The majority of the data we have on clouds are from the 20th century. One of the project goals was to update our databases on clouds in order to conduct proper research on climate change. Tina Rogerson, Cloud Gaze’s data analyst, gathers this information and compiles it into easily accessible files. The files include data from a range of different sources: satellites, Globe observations, and Zooniverse classifications (see https://observer.globe.gov/get-data). They give people a chance to analyze clouds at different points and connect the dots to analyze the whole.
Scientist Marilé Colón Robles explained that one of the goals of the project is to make a climatology of cloud types based on the data they have collected. This would help us have a record on how the clouds have changed in a given location in relation to the climate of that area. We would have information on the entire world, every single continent, yes, including Antarctica.
Why did I pick this project to focus on?
I chose this project because I wanted to challenge myself. I have always shied away from topics and conversations about climate change and global warming. I felt I could never fully comprehend it so I should instead avoid it by all means possible. My fellow interns and I had three projects to choose from: Transcribe Color Convention, Active Asteroids, and NASA GLOBE CLOUD GAZE. If it were any other day, I would have chosen one of the first two projects to be my focus but I wanted to change, to try something new. The only way to grow is to step out of your comfort zone and I am so glad I did.
People make the mistake of believing that climate change can’t be helped and that after our Earth becomes inhabitable we can just pull a Lost In Space and find a different planet to live on. I had the chance to speak with Dr. Michelle B. Larson, CEO of Adler Planetarium, and we talked about how there isn’t another planet for us to go to if we mess this one up. Even if there was, it would take years and a lot of resources to ready the planet for ourselves. Those are resources and years that we could be spending on fixing our home.
The CLOUD GAZE focused on one of the most important and understudied factors in Earth’s climate – clouds. People all over the world are helping in their own way to help save the planet. Some make sure to always recycle their garbage. Some take public transportation more often, and switch to electronic vehicles to cut down on their carbon footprint. You and I can help by taking pictures of our sky, submitting it in the GLOBE Observer app, and by going to the Zooniverse Cloud GAZE project, classifying as little as 10 images of clouds per day to multiply the data on clouds, which in turn helps further our research and our understanding of climate change.
Engaging Faith-based Communities in Citizen Science through Zooniverse was an initiative designed to broaden participation in people-powered research (also referred to as citizen science) among religious and interfaith communities by helping them to engage with science through Zooniverse. Citizen science is a powerful way to build positive, long-term relationships across diverse communities by “putting a human face” on science and scientists. Participating in real scientific research is a great way to learn about the process of science as well as the scientists who conduct research.
The Engaging initiative provided models for how creative partnerships can be formed between scientific and religious communities that empower more people to become collaborators in the quest for knowledge. It included integrating Zooniverse projects into seminary classes as well as adult, youth, and intergenerational programs of religious communities; and promoting Zooniverse among interfaith communities concerned with environmental justice. Among other things, the project’s evaluation highlighted the need for scientists to do a better job of engaging with religious audiences in order to address racial and gender disparities in science. I encourage Zooniverse research teams to check out the series of short videos recently released by the AAAS Dialogue on Science, Ethics, and Religion to help scientists engage more effectively with communities of faith. By interacting personally with these communities and helping to “put a human face” on science, you may not only increase participation in your research projects, but help in the effort to diversify science in general.
Despite the difficulties imposed by the pandemic, I’m encouraged by what the Engaging initiative achieved, and the possibilities for expanding its impact in the future! The summary article of this project was published on March 28, 2022 by the AAAS Dialogue on Science, Ethics, and Religion.
The project team thanks the Alfred P. Sloan Foundation for supporting this project. Any opinions, findings, or recommendations expressed are those of the project team and do not necessarily reflect the views of the Sloan Foundation.
Over the years a growing number of companies have included Zooniverse in their digital engagement and volunteer efforts, connecting their employee network with real research projects that need their help.
It’s been lovely hearing the feedback from employees:
“This was an awesome networking event where we met different team members and also participated in a wonderful volunteer experience. I had so much fun!”
“This activity is perfectly fitted to provide remote/virtual support. You can easily review photos from anywhere. Let’s do this again!”
“Spotting the animals was fun; a nice stress reliever!’
The impact of these partnerships on employees and on Zooniverse has been tremendous. For example, in 2020 alone, 10,000+ Verizon employees contributed over a million classifications across dozens of Zooniverse projects. With companies small to large incorporating Zooniverse into their volunteer efforts, this new stream of classifications has been a tremendous boon for helping propel Zooniverse projects towards completion and into the analysis and dissemination phases of their efforts. And the feedback from employees has been wonderful — participants across the board express their appreciation for having a meaningful way to engage in real research through their company’s volunteer efforts.
A few general practices that have helped set corporate volunteering experiences up for success:
Focus and choice: Provide a relatively short list of recommended Zooniverse projects that align with your company’s goals/objectives (e.g., topic-specific, location-specific, etc.), but also leave room for choice. We have found that staff appreciate when a company provides 3-6 specific project suggestions (so they can dive quickly into a project), as well as having the option to choose from the full list of 70+ projects at zooniverse.org/projects.
Recommend at least 3 projects: This is essential in case there happens to be a media boost for a given project before your event and the project runs out of active data*. Always good to have multiple projects to choose from.
Team building: Participation in Zooniverse can be a tremendous team building activity. While it can work well to just have people participate individually, at their own convenience, it also can be quite powerful to participate as a group. We have created a few different models for 1-hour, 3-hour, and 6-hour team building experiences. The general idea is that you start the session as a group to learn about Zooniverse and the specific project you’ll be participating in. You then set a Classification Challenge for the hour (e.g., as a group of 10, we think we can contribute 500 classifications by the end of the hour). You play music in the background while you classify and touch base halfway through to see how you’re doing towards your goal (by checking your personal stats at zooniverse.org) and to share interesting, funny, and/or unusual images you’ve classified. At the end of the session, you celebrate reaching your group’s Classification Challenge goal and talk through a few reflection questions about the experience and other citizen science opportunities you might explore in the future.
Gathering stats: Impact reports have been key in helping a company tell the story of the impact of their corporate volunteering efforts, both internally to their employee network and externally to their board and other stakeholders.
Some smaller companies (or subgroups within a larger company) manually gather stats about their group’s participation in Zooniverse. They do this by taking advantage of the personal stats displayed within the Zooniverse.org page (e.g., number of classifications you’ve contributed). They request that their staff register and login to Zooniverse before participating and send a screenshot of their Zooniverse.org page at the end of each session. The team lead then adds up all the classifications and records the hours spent as a group participating in Zooniverse.
If manual stats collection is not feasible for your company, don’t hesitate to reach out to us at contact@zooniverse.org to explore possibilities together.
We’ve also created a variety of bespoke experiences for companies who are interested in directly supporting the Zooniverse. Please email contact@zooniverse.org if you’re interested in exploring further and/or have any questions.
*Zooniverse project datasets range in size; everything from a project’s dataset being fully completed within a couple weeks (e.g., The Andromeda Project) to projects like Galaxy Zoo and Snapshot Serengeti that have run and will continue to run for many years. But even for projects that have data that will last many months or years, standard practice is to upload data in batches, lasting ~2-4 months. When a given dataset is completed, this provides an opportunity for the researchers to share updates about the project, interim results, etc. and encourage participation in the next cycle of active data.
What are “Yellowballs?” Shortly after the Milky Way Project (MWP) was launched in December 2010, volunteers began using the discussion board to inquire about small, roundish “yellow” features they identified in infrared images acquired by the Spitzer Space Telescope. These images use a blue-green-red color scheme to represent light at three infrared wavelengths that are invisible to our eyes. The (unanticipated) distinctive appearance of these objects comes from their similar brightness and extent at two of these wavelengths: 8 microns, displayed in green, and 24 microns, displayed in red. The yellow color is produced where green and red overlap in these digital images. Our early research to answer the volunteers’ question, “What are these `yellow balls’?” suggested that they are produced by young stars as they heat the surrounding gas and dust from which they were born. The figure below shows the appearance of a typical yellowball (or YB) in a MWP image. In 2016, the MWP was relaunched with a new interface that included a tool that let users identify and measure the sizes of YBs. Since YBs were first discovered, over 20,000 volunteers contributed to their identification, and by 2017, volunteers catalogued more than 6,000 YBs across roughly 300 square degrees of the Milky Way.
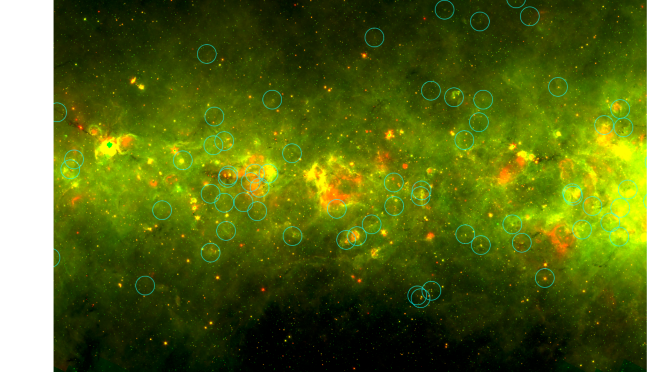
New star-forming regions. We’ve conducted a pilot study of 516 of these YBs that lie in a 20-square-degree region of the Milky Way, which we chose for its overlap with other large surveys and catalogs. Our pilot study has shown that the majority of YBs are associated with protoclusters – clusters of very young stars that are about a light-year in extent (less than the average distance between mature stars.) Stars in protoclusters are still in the process of growing by gravitationally accumulating gas from their birth environments. YBs that represent new detections of star-forming regions in a 6-square-degree subset of our pilot region are circled in the two-color (8 microns: green, 24 microns: red) image shown below. YBs present a “snapshot” of developing protoclusters across a wide range of stellar masses and brightness. Our pilot study results indicate a majority of YBs are associated with protoclusters that will form stars less than ten times the mass of the Sun.
YBs show unique “color” trends. The ratio of an object’s brightness at different wavelengths (or what astronomers call an object’s “color”) can tell us a lot about the object’s physical properties. We developed a semi-automated tool that enabled us to conduct photometry (measure the brightness) of YBs at different wavelengths. One interesting feature of the new YBs is that their infrared colors tend to be different from the infrared colors of YBs that have counterparts in catalogs of massive star formation (including stars more than ten times as massive as the Sun). If this preliminary result holds up for the full YB catalog, it could give us direct insight into differences between environments that do and don’t produce massive stars. We would like to understand these differences because massive stars eventually explode as supernovae that seed their environments with heavy elements. There’s a lot of evidence that our Solar System formed in the company of massive stars.
The figure below shows a “color-color plot” taken from our forthcoming publication. This figure plots the ratios of total brightness at different wavelengths (24 to 8 microns vs. 70 to 24 microns) using a logarithmic scale. Astronomers use these color-color plots to explore how stars’ colors separate based on their physical properties. This color-color plot shows that some of our YBs are associated with massive stars; these YBs are indicated in red. However, a large population of our YBs, indicated in black, are not associated with any previously studied object. These objects are generally in the lower right part of our color-color plot, indicating that they are less massive and cooler then the objects in the upper left. This implies there is a large number of previously unstudied star-forming regions that have been discovered by MWP volunteers. Expanding our pilot region to the full catalog of more than 6,000 YBs will allow us to better determine the physical properties of these new star-forming regions.
Volunteers did a great job measuring YB sizes! MWP volunteers used a circular tool to measure the sizes of YBs. To assess how closely user measurements reflect the actual extent of the infrared emission from the YBs, we compared the user measurements to a 2D model that enabled us to quantify the sizes of YBs. The figure below compares the sizes measured by users to the results of the model for YBs that best fit the model. It indicates a very good correlation between these two measurements. The vertical green lines show the deviations in individual measurements from the average. This illustrates the “power of the crowd” – on average, volunteers did a great job measuring YB sizes!
Stay tuned… Our next step is to extend our analysis to the entire YB catalog, which contains more than 6,000 YBs spanning the Milky Way. To do this, we are in the process of adapting our photometry tool to make it more user-friendly and allow astronomy students and possibly even citizen scientists to help us rapidly complete photometry on the entire dataset.
Our pilot study was recently accepted for publication in the Astrophysical Journal. Our early results on YBs were also presented in the Astrophysical Journal, and in an article in Frontiers for Young Minds, a journal for children and teens.
For the second year in a row, we’re honoring the hundreds of thousands of contributors, research teams, educators, Talk moderators, and more who make Zooniverse possible. This second edition of Into the Zooniverse highlights another 40 of the many projects that were active on the website and app in the 2019 – 20 academic year.
In that year, the Zooniverse has launched 65 projects, volunteers have submitted more than 85 million classifications, research teams have published 35 papers, and hundreds of thousands of people from around the world have taken part in real research. Wow!
To get your copy of Into the Zooniverse: Vol II, download a free pdf here or order a hard copy on Blurb.com. Note that the cost of the book covers production and shipping; Zooniverse does not receive profit through sales. According to the printer, printing and binding take 4-5 business days, then your order ships. To ensure that you receive your book before December holidays, you can use this tool to calculate shipping times.
Now it’s even easier to contribute to science from your phone!
On any crowded public bus (before the pandemic), people sat next to each other, eyes fixed on their phones, smiling, swiping.
What were they all doing? Using a dating app, maybe. Or maybe they were separating wildcam footage of empty desert from beautiful birds. Maybe they were spotting spiral arms on faraway galaxies.
Maybe one of them was you!
We’ve loved seeing the participation in the Zooniverse through the mobile app (available for iOS and Android) over the past two years. So we made it even easier for you to do that wherever you swipe these days—a park bench, or maybe your home. (Please don’t swipe and drive).
Right now, you can go into the app and contribute to Galaxy Zoo Mobile, Catalina Outer Solar System Survey, Disk Detective, Mapping Historic Skies, Nest Quest Go, or Planet Four: Ridges. And we have more projects on the way!
What’s new in the app
When you update to version 2.8.2, you’ll notice a slick new look. At the very top, there’s now an “All Projects” category. This will show you everything available for mobile—with the projects that need your help the most sorted at the very top! You can also still choose a specific discipline, of course.
That’s it for features that are totally new, but a lot of features in this version are fixed. No more crashing when you tap on browser projects. A lot fewer project-related crashes. Animated gifs, which previously worked only on iOS, now also work on Android—so researchers can show you an image that changes over time.
What’s more—and you’ll never see this, but it’s important to us, the developers—we’ve made a lot of changes that help us keep improving the app. We have better crash reporting mechanisms and more complete automated testing. We also updated all of our documentation so that developers from outside our team can contribute to the app, too! We’d love to be a go-to open source project for people who are learning, or working in, React Native (the platform on which our app is built).
Aggregate Functionality
The full list of functionalities now includes:
Swipe (binary question [A or B.] response)
Single-answer question (A, B, or C)
Multi-answer question (any combination of A, B, and C.)
Rectangle drawing task (drawing a rectangle around a feature within a subject)
Single-image subjects
Multi-image subjects (e.g. uploading 2+ images as a single subject; users swipe up/down to display the different images)
Animated gifs as subjects
Subject auto-linking (automatically linking subjects retired from one workflow into another workflow of interest on the same project)
Push notifications (sending messages/alerts about new data, new workflows, etc., via the app)
Preview (an owner or collaborator on a project in development being able to preview a workflow in the ‘Preview’ section of the mobile app)
Beta Review (mobile enabled workflows are accessible through the ‘Beta Review’ section of the app for a project in the Beta Review process; includes an in-app feedback form)
Ability to see a list of all available projects, as well as filter by discipline (with active mobile app workflows listed at the top)
We also carried out a number of infrastructure improvements, including:
Upgrades to the React Native libraries we use
Created a staging environment to test changes before they are implemented in full production
Additional test coverage
Implemented bug reporting and tracking
Complete documentation, so open source contributors can get the app running from our public code repository
And a myriad of additional improvements like missing icons no longer crashing the app, improvements to the rectangle drawing task, etc.
Note: we will continue developing the app; this is just the end of this phase of effort and a great time to share the results.
If you’re leading a Zooniverse project and have any questions about where in the Project Editor ‘workflow’ interface to ‘enable on mobile’, don’t hesitate to email contact@zooniverse.org. And/or if you’re a volunteer and wonder if workflow(s) on a given project could be enabled on mobile, please post in that project’s Talk to start the conversation with the research team and us. The more, the merrier!
Looking forward to having more projects on the mobile app!
A Few Stats of Interest:
Since Jan 1, 2020:
6.2 million classifications submitted via the app (that’s 7% of 86.7 million classifications total through Zooniverse projects)
18,000 installations on iOS + 17,000 on Android
Current Active Users (people who have used the app in the last 30 days):
1,800 on iOS + 7,700 on Android
Previous Blog Posts about the Zooniverse Mobile App:
The following is an update from the SuperWASP Vairable Stars research team. Enjoy!
Welcome to the Spring 2020 update! In this blog, we will be sharing some updates and discoveries from the SuperWASP Variable Stars project.
What are we aiming to do?
We are trying to discover the weirdest variable stars!
Stars are the building blocks of the Universe, and finding out more about them is a cornerstone of astrophysics. Variable stars (stars which change in brightness) are incredibly important to learning more about the Universe, because their periodic changes allow us to probe the underlying physics of the stars themselves.
We have asked citizen scientists to classify variable stars based on their photometric light curves (the amount of light over time), which helps us to determine what type of variable star we’re observing. Classifying these stars serves two purposes: firstly to create large catalogues of stars of a similar type which allows us to determine characteristics of the population; and secondly, to identify rare objects displaying unusual behaviour, which can offer unique insights into stellar structure and evolution.
We have 1.6 million variable stars detected by the SuperWASP telescope to classify, and we need your help! By getting involved, we can build up a better idea of what types of stars are in the night sky.
What have we discovered so far?
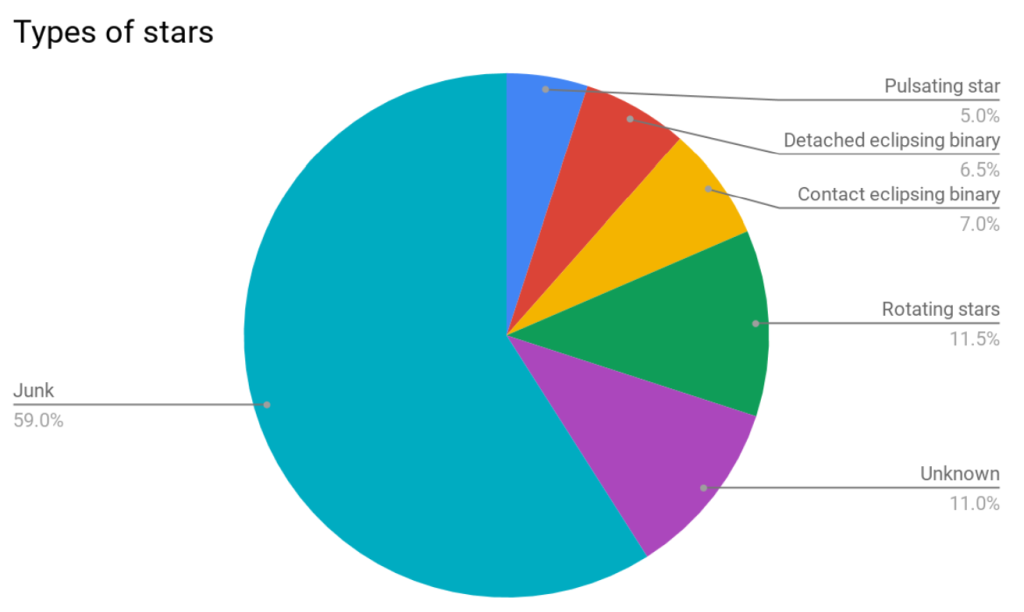
We’ve done some initial analysis on the first 300,000 classifications to get a breakdown of how many of each type of star is in our dataset.
So far it looks like there’s a lot of junk light curves in the dataset, which we expected. The programme written to detect periods in variable stars often picks up exactly a day or a lunar month, which it mistakes for a real period. Importantly though, you’ve classified a huge number of real and exciting light curves!
We’re especially excited to do some digging into what the “unknown” light curves are… are there new discoveries hidden in there? Once we’ve completed the next batch of classifications, we’ll do some more to see whether the breakdown of types of stars changes.
An exciting discovery…
In late 2018, while building this Zooniverse project, we came across an unusual star. This Northern hemisphere object, TYC-3251-903-1, is a relatively bright object (V=11.3) which has previously not been identified as a binary system. Although the light curve is characteristic of an eclipsing contact binary star, the period is ~42 days, notably longer than the characteristic contact binary period of less than 1 day.
Spurred on by this discovery, we identified a further 16 candidate near-contact red giant eclipsing binaries through searches of archival data. We were excited to find that citizen scientists had also discovered 10 more candidates through this project!
Figure 1: Artist’s impression of a contact binary star [Mark A. Garlick] Over the past 18 months, we’ve carried out an observing campaign of these 27 candidate binaries using telescopes from across the world. We have taken multi-colour photometry using The Open University’s own PIRATE telescope, and the Las Cumbres Observatory robotic telescopes, and spectroscopy of Northern candidates with the Liverpool Telescope, and Southern candidates using SALT. We’ve also spent two weeks in South Africa on the 74-inch telescope to take further spectroscopy.
Of the 10 candidate binaries discovered by citizen scientists, we were happy to be able to take spectroscopic observations for 8 whilst in South Africa, and we have confirmed that at least 2 are, in fact, binaries! Thank you citizen scientists!
Why is this discovery important?
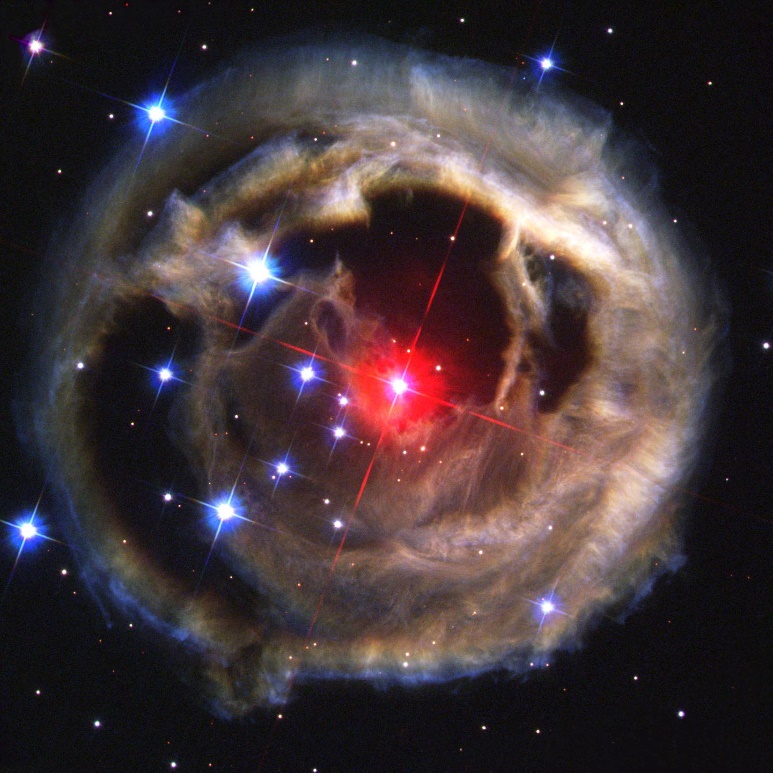
Figure 2: V838 Mon and its light echo [ESA/NASA]
The majority of contact or near-contact binaries consist of small (K/M dwarf) stars in close orbits with periods of less than 1 day. But for stars in a binary in a contact binary to have such long periods requires both the stars to be giant. This is a previously unknown configuration…
Interestingly, a newly identified type of stellar explosion, known as a red nova, is thought to be caused by the merger of a giant binary system, just like the ones we’ve discovered.
Red novae are characterised by a red colour, a slow expansion rate, and a lower luminosity than supernovae. Very little is known about red novae, and only one has been observed pre-nova, V1309 Sco, and that was only discovered through archival data. A famous example of a possible red nova is the 2002 outburst in V838 Mon. Astronomers believe that this was likely to have been a red nova caused by a binary star merger, forming the largest known star for a short period of time after the explosion.
So, by studying these near-contact red giant eclipsing binaries, we have an unrivalled opportunity to identify and understand binary star mergers before the merger event itself, and advance our understanding of red novae.
What changes have we made?
Since the SuperWASP Variable Stars Zooniverse project started, we’ve made a few changes to make the project more enjoyable. We’ve reduced the number of classifications needed to retire a target, and we’ve also reduced the number of classifications of “junk” light curves needed to retire it. This means you should see more interesting, real, light curves.
We’ve also started a Twitter account, where we’ll be sharing updates about the project, the weird and wacky light curves you find, and getting involved in citizen science and astronomy communities. You can follow us here: www.twitter.com/SuperWASP_stars
What’s next?
We still have thousands of stars to classify, so we need your help!
Once we have more classifications, we will be beginning to turn the results into a publicly available, searchable website, a bit like the ASAS-SN Catalogue of Variable Stars (https://asas-sn.osu.edu/variables). Work on this is likely to begin towards the end of 2020, but we’ll keep you updated.
We’re also working on a paper on the near-contact red giant binary stars, which will include some of the discoveries by citizen scientists. Expect that towards the end of 2020, too.
Otherwise, watch this space for more discoveries and updates!
We would like to thank the thousands of citizen scientists who have put time into this Zooniverse project. If you ever have any questions or suggestions, please get in touch.
The Zooniverse Blog. We're the world's largest and most successful citizen science platform and a collaboration between the University of Oxford, The Adler Planetarium, and friends