

We’re happy that in the three weeks since the email newsletter advertising the Zooniverse Mobile App (available on the Apple App Store for iOS and Google Play for Android) we’ve seen a great response from the Zooniverse community!
Exciting Numbers
New downloads of the app show that Zooniverse volunteers are interested in contributing to projects while on their phones. Since July 15th, the iOS app has been downloaded more than 1,620 times, and the Android app more than 1,000 times. In total, the app has been downloaded more than 30,000 times since its first release!
When it comes to classifications, mobile workflows are making an impact. Since July 15th, over 30% of submitted classifications have come from the Zooniverse Mobile App — that’s over 800,000 classifications! These numbers show that there is a willing community of volunteers ready to contribute through their mobile devices.
How Zooniverse Projects Use the Mobile App
The mobile app is a great tool that’s been used in a number of different ways by Zooniverse projects. In some cases, a project’s entire classification task can be included in the mobile app — for example, check out Bash the Bug and Radio Meteor Zoo. For other projects, workflows hosted on the mobile app provide crucial help by sorting and filtering images. As an example, multiple projects use simple “Yes/No” questions to filter out and retire empty images, which significantly reduces the total number of classifications required for the project.
One example where this filtering technique was recently tested: the Local Group Cluster Search project, which is searching for star clusters in images of nearby galaxies. We examined how mobile-based classifications stack up to those made through the project’s primary drawing-based workflow by posting images in both mobile app and desktop browser workflows to make a direct comparison between the two. We show in the plot below that classifications obtained via the mobile app workflow agree well with those obtained through the drawing workflow, as shown by the trend highlighted by the red line.
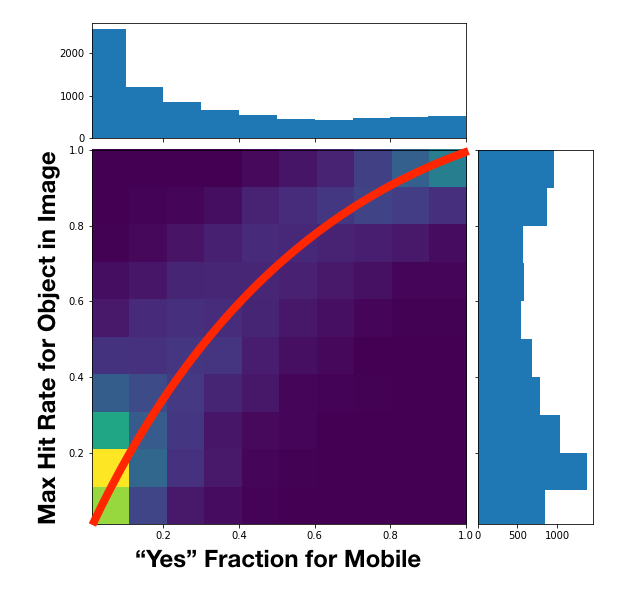
This successful test demonstrates that filtering workflows in the mobile app can be used to identify blank images and retire these subjects quickly. In the case of the Local Group Cluster Search, we estimate that the number of classifications needed to complete the search will be reduced by 30% — that’s significant volunteer effort saved!
We look forward to the continued success of the Zooniverse Mobile App! Download the app today from the Apple App Store or Google Play. For more information on the mobile app, check out these blog posts.
