Tag Archives: citizen science

An Educator’s Guide To Our Group Engagement Tools

Over the years, one of the most common requests from educators has been for tools to support group engagement in Zooniverse and better tell your story of collective impact. We’re so grateful for a grant from NASA enabling us to build these new tools to meet those needs. 

Whether you’re a library or museum educator, a camp counselor, or a classroom teacher, read  on to discover how Zooniverse can enhance your educational goals.

Zooniverse is the world’s largest platform for people-powered research, with millions of participants and dozens of active projects across various disciplines. By using Zooniverse, you join a global network of educators offering students often their first opportunity to engage in real research. From classifying galaxies and tagging penguins to transcribing historic documents and marking the structure of cells for cancer research, Zooniverse projects span a wide array of research fields.

For a list of curricular resources for educators, including lesson plans, instructor guides, and more, check out zooniverse.org/get-involved/education

Tracking Individual and Collective Impact

Zooniverse offers easy ways to track both individual and collective impact, making it easy to use in educational settings. You can assign tasks, motivate participation, set up friendly competitions between classes, and more. 

Personal Stats

When logged into Zooniverse, each individual sees their own stats, including classification counts and hours spent. A valuable feature for fulfilling service hour requirements is the ability to generate a signed volunteer certificate

Group Stats

Groups in Zooniverse can view their collective impact, set shared goals, and celebrate milestones. These tools empower educators to engage students in new ways.

Step 1: Create Your Group

Go to zooniverse.org, sign in, and scroll down to ‘My Groups’. Click ‘Create New Group.’ Name your group appropriately, such as “Hammond’s 4th Period Biology” or “Davis County Public Library.”

As the admin, you can decide if the group stats page will be publicly viewable or only accessible to group members. Additionally, you can choose whether to display individual stats or only aggregate results. For example, if your group stats page is public, you can set it so that only you can see individual stats, or you can allow other group members or everyone to see them. Through the admin pop-up, you can update your group settings or remove group members at any time.

For additional Group details/features, see this blog post

Step 2: Invite Participants to Join Your Group

Have your students or program participants create a Zooniverse account by clicking ‘Register’ in the upper-right corner of zooniverse.org. To invite them to join your group, click the ‘Copy Join Link’ on your group’s page and share it via email or other preferred means, such as creating a QR code.

Once they click the join link, all classifications they do on any Zooniverse project will be included in your group stats page, contributing to your group’s collective impact. 

Step 3: View/Share Your Group Stats

When viewing your group stats page, you can use the drop-down options on the upper-right of the stats bar chart to filter to a specific time period and/or project of interest. Another helpful feature is the ‘See detailed stats’ option, where you can view all group contributors’ stats and generate a .CSV file for further analysis. A future feature will be the ability to filter to specific time periods within this detailed stats page. 

Members of your group will also be able to view the group stats page. Depending on the choices you’ve made in the admin settings, group members will either be able to only view the aggregate stats OR they’ll be able to view both the aggregate and individual stats. 

If you’ve set your group visibility settings to ‘public’, you’ll have the ‘Share Group’ option at the top of your group’s stats page. Clicking ‘Share group’ will copy a link to the public-facing view of your group’s stats page. This is different from a ‘Join Link’. Anyone with the ‘Share Group’ link will simply be able to view the group’s stats, but will not be added as a member of the group. 

Celebrating Milestones

A few Zooniverse project teams have created short thank you videos, which are great rewards to share with your students after reaching a collective milestone.

Example: STEM Club at a Public Library

Imagine you lead a STEM club at your local public library. You create a group, set the settings to public but only for aggregate results (i.e, not showing individual stats publicly), copy the join link, and share it with your group members. You set a classification challenge for the week, share recommended projects (see zooniverse.org/projects for the full list), and encourage free choice. Throughout the week, you update your group on progress toward your goal. At your next meeting, you celebrate reaching the goal with a thank you video and highlight top contributors with special rewards. Then, you set the next week’s challenge to keep the momentum going.

Other Use Cases

  • Friendly competition among class periods
  • Extra credit opportunities for your students
  • Extension activity after a museum field trip experience
  • Summer camp group tracking independent research time

Share your Stories of Impact with Us

We’d love to hear about your experience and share your stories of impact with the broader Zooniverse community to spark ideas and inspiration in others. See this Daily Zooniverse post as an example. Email us at contact@zooniverse.org with your stories! 

Get in Touch

If you have questions or need advice, join the conversation in our dedicated Talk discussion forum around Education and the Zooniverse or email us at contact@zooniverse.org. 

On behalf of Zooniverse, we are incredibly grateful that you choose to use participatory science in your educational programs and hope to continue fostering this innovative community of educators around the world.

Thank you for including Zooniverse in your educational efforts!

Launch News: Community-Building Pages

At the Zooniverse, we strive to foster a vibrant community of software engineers, researchers, and public participants. Each week the Zooniverse volunteer community contributes over 1 million classifications across ~80 active projects. This collective effort has contributed to hundreds of publications. Many of you have experienced first-hand or heard about serendipitous discoveries through Talk or by reading a project’s results page. Your contributions make a real difference in advancing scientific research and discovery worldwide. 

To further encourage and support this sense of collective effort leading to discovery, we’re exploring additional pathways for people to connect. With newly implemented Group Engagement features, like-minded participants can connect, collaborate on projects, and work together toward shared goals.

We can’t wait to see the creative ways our community will make the most of this new Groups feature!

Introducing the new Zooniverse Groups community-building pages.

WHAT IS IT?

With the new Groups feature, you will be able to track collaborative achievements with friends and family, fellow science enthusiasts, educational groups, and more* within the Zooniverse community. Track your stats and see which projects trend within your group.

HOW DOES IT WORK?

Creating a Group

Once you’re logged in to Zooniverse, you can select ‘Create New Group’ from the ‘My Groups’ panel in the zooniverse.org homepage. By creating a new group you are the admin of the group. 

Creating a new Zooniverse Group.

First, name your group. You can use any combination of characters including special characters and emojis. Next, select your group permissions. The private selection will only allow group members to access and view your group’s stats page. The public selection will make the group stats page viewable by anyone. Then, choose your members’ individual stats visibility. You can choose whether to never show each contributor’s stats, always show them, or only show them to members of the group. A group admin will always see these individual stats. Finally, click “Create New Group”. You will be brought to your new group stats page where you can then copy the join link and invite members. More on joining a Group below.

Using the Bar Chart

From the homepage click on any of your groups to view that group’s stats page. The bar chart will default to showing your stats for all contributors for all projects from the last 7 days.

Using the Zooniverse Groups bar chart.

To change the time range or projects use the dropdown menus above the chart. Note that if you change the dates, it will also change which projects are selectable based on your activity in that time period. The Hours tab shows a summary of the time spent across your group classifying subjects. 

Top Projects

These are your most classified projects for the selected time period. If you change the time frame, you can expect your top projects to update as well.

Top Contributors

Next is a list of top contributors (group members with the most classifications during the specified time period). You can see a more detailed view if you click ‘See all contributors and detailed stats’. This will bring you to a full list of contributors and their stats across all time. Clicking ‘Export all stats’ generates a .csv file. A future feature will be the ability to filter to specific time periods within this detailed stats page. 

Showing all Zooniverse Groups participants' stats.

Managing a Group

From the homepage click on any of your groups to view your group’s stats page. If you’re the admin for a group, you’ll have a ‘Manage Group’ option at the top of the group’s stats page. When you click on ‘Manage Group’, you will see the same settings as when you first created the group. You can change these admin settings at any time. You will also be able to manage the members of your group. Navigate to a member’s row and click on the 3-dot options menu. Here you can give admin access, remove admin access (if previously given), or remove a member. Note: as long as someone has a ‘Join Link’, they can always rejoin the group at any time. Press “Save changes” to return to your group. 

Managing your Zooniverse Group.

If you click ‘Deactivate Group’, this removes the group and its stats’ visibility (making the group unsearchable and unjoinable). Note: this does not delete the group from our internal Zooniverse database. 

Joining a Group

In order to join a group, the group admin or a group member will share the ‘Join Link’ for that group with you. The ‘Join Link’ is at the top of the group’s stats page. 

Using the Zooniverse Groups join link.

Once you have the link, simply click it to be added to the group. Note: you must be logged-in in order to join a group. Once you’ve joined, you’ll immediately be able to view your group’s stats page. 

At any time, you can view all of your groups by clicking ‘See all’ within the ‘My Groups’ panel in your zooniverse.org homepage. 

You may notice a few existing groups with alphanumeric names (e.g., 597C5881-3808-4DF7-B91A-D29E58E19FFC) in your groups list. These groups were created via our classroom.zooniverse.org portal for curricula such as Wildcam Labs or Galaxy Zoo 101. If you’re the group admin (indicated by the ‘admin’ label), you can click ‘Manage Group’ to give your group a more descriptive name. If you’re a group member, you can either click ‘Leave Group’ (if the class experience is complete) or ask your instructor (the admin) to rename the group. In future updates, we’ll enable naming groups directly within the classroom.zooniverse experiences.

Leaving a Group

From the homepage click on any of your groups. At the top of the group’s stats page, click ‘Leave group’. Note: you can rejoin a group at any time as long as you still have access to the unique Join Link.

Sharing a Group

If the admin of your group has set your group visibility settings to ‘public’, you’ll have the ‘Share Group’ option at the top of your group’s stats page. Clicking ‘Share group’ will copy a link to the public-facing view of your group’s stats page. This is different from a ‘Join Link’. Anyone with the ‘Share Group’ link will simply be able to view the group’s stats, but will not be added as a member of the group. 

Example of a Group

In November 2024 we interviewed members of PSR J0737-3039 – a Zooniverse group focused on space projects – to learn why and how Zooniverse contributors use this feature. Read the full interview.

JOIN THE CONVERSATION

We value your feedback! We’re keen to hear about your experiences with the new Groups feature. Please share in this Talk thread and mention @support if you are experiencing any issues.

*Corporate Groups

If you are a corporate group interested in including Zooniverse in your digital engagement and volunteering efforts, please see this blog post and email us at contact@zooniverse.org to learn more about our Zooniverse Corporate Partnership Program. Access to the Groups feature is available to corporate partners as part of our partnership levels.

Freshening up the Zooniverse Homepage

The Zooniverse has come a long way since beginning our journey together in 2009 – from the launch of the Project Builder to supporting diverse task types across the disciplines, including transcription, tagging, and marking. This fall, we’re continuing our frontend codebase migration and design evolution with a fresh, modern redesign to some of our main pages – this update focuses on freshening up our homepage.

What’s New?

  • Your Stats: Now, you can more easily track your progress and goals. See all your classification stats on one page and filter by project or time frame.
  • Volunteer Recognition: We heard you! Create personalized volunteer certificates right on the homepage. Perfect for students needing proof of volunteer hours!
  • Group Engagement: Create your group, set up goals and see the impact you’re making together. Great for families, teams, classrooms, or friends working on projects together.
  • Easy Navigation: Click the Zooniverse logo in the upper-left corner of any page to return to your homepage easily.

Read on for more details.

Zooniverse Redesigned Homepage

The zooniverse.org homepage serves a broad audience of new and returning volunteers, educators, and researchers. We believe the homepage should be a central hub where these different audiences can find the tools they need to make their Zooniverse experience satisfying and worthwhile. Now you’ll be able to pick up where you left off classifying, see your stats at a glance, and follow up on your last classifications to add them to a collection, favorite, or comment.

A common request over the years has been better tools for capturing individual and group impact. Thanks to support from NASA, we’ve been working hard to implement improved personal stats and new features that allow you to see the collective impact of your groups – whether you’re a family, a corporate team, a classroom, or simply a group of friends passionate about participating in projects together. We’ve made significant strides in bringing these functionalities to life.

Key features of your new homepage:

Personalized Statistics: We’re making it a little easier to keep track of your progress and goals. Now all of your real-time classification stats can be found on one page and you can filter by project or by a specific time frame. Access detailed information about your contributions, including the number of classifications, projects you’ve worked on, and your impact over time. 

Zooniverse Personal Statistics

A foundational step in this effort was a complete overhaul of our stats infrastructure to ensure greater reliability and stability. Moving forward, zooniverse.org personal stats will pull data exclusively from our updated stats server, reflecting contributions from 2007 onwards.

Volunteer Recognition: Generate personalized volunteer certificates right from your Zooniverse homepage! Customizable to specific time periods and projects. An often requested feature for students fulfilling volunteer service hour requirements. 

Zooniverse Volunteer Certificate

Group Engagement: A new way to create and share group goals and tell the story of your collective impact. Read this blog post for more details. 

Zooniverse Group Engagement Statistics

Streamlined Navigation: Enjoy an easier flow by clicking the Zooniverse logo in the upper-left on any page to return to your homepage.

We value your feedback! We launched the new homepage in September of 2024. If you encounter any difficulties or have questions as you’re using the new homepage, please share them in this Talk thread and mention @support.

Bursts from Space

This is a guest post by summer intern Anastasia Unitt.

The study of celestial objects creates a huge amount of data. So much data, that astronomers struggle to make use of it all. The solution? Citizen scientists, who lend their brainpower to analyse and catalogue vast swathes of information. Alex Andersson, a DPhil student at the University of Oxford, has been applying this approach to his field: radio astronomy, through the Zooniverse. I met with him via Zoom to learn about his project detecting rare, potentially explosive events happening far out in space.

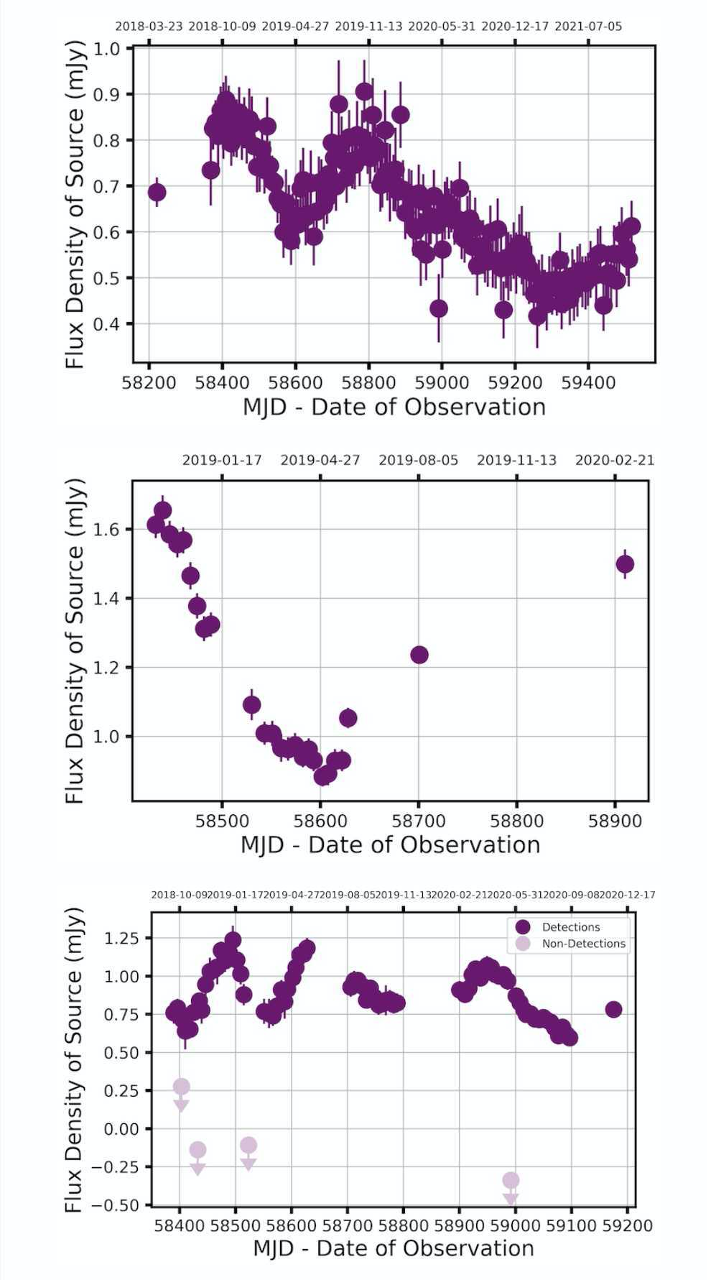
Alex’s research uses data collected by a radio telescope located thousands of miles away in South Africa, named MeerKAT. The enormous dishes of the telescope detect radio waves, captured from patches of sky about twice the size of the full Moon. This data is then converted into images, which show the source of the waves, and into light curves, a kind of scatter plot which depicts how the brightness of these objects has changed over time. This information was initially collected for a different project, so Alex is exploiting the remaining information in the background- or, as he calls it: “squeezing science out of the rest of the picture.” The goal: to identify transient sources in the images, things that are changing, disappearing and appearing.

Historically, relatively few of these transients have been identified, but the many extra pairs of eyes contributed by citizen scientists has changed the game. The volume of data analysed can be much larger, the process far faster. Alex is clearly both proud of and extremely grateful to his flock of amateur astronomers. “My scientists are able to find things that using traditional methods we just wouldn’t have been able to find, [things] we would have missed.” The project is ongoing, but his favourite finding so far took the form of a “blip” his citizen scientists noticed in just two of the images (out of thousands). Alex explains: “We followed it up and it turns out it’s this star that’s 10 times further away than our nearest stellar neighbor, and it’s flaring. No one’s ever seen it with a radio telescope before.” His excitement is obvious, and justified. This is just one of many findings that may be previously unidentified stars, or even other kinds of celestial objects such as black holes. There’s still so much to find out, the possibilities are almost endless.

A range of light curve shapes spotted by Zooniverse citizen scientists performing classifications for Bursts from Space: MeerKAT

Unfortunately, research comes with its fair share of frustrating moments along with the successes. For Alex, it’s the process of preparing the data for analysis which has proved the most irksome. “Sometimes there’s bits in the process that take a long time, particularly messing with code. There can be so much effort that went into this one little bit, that even if you did put it in a paper is only one sentence.” These behind-the-scenes struggles are essential to make the data presentable to the citizen scientists in the first place, as well as to deal with the thousands of responses which come out the other side. He assures me it’s all worth it in the end.

As to where this research is headed next, Alex says the prospects are very exciting. Now they have a large bank of images that have been analysed by the citizen scientists, he can apply this information to train machine learning algorithms to perform similar detection of interesting transient sources. This next step will allow him to see “how we can harness these new techniques to apply them to radio astronomy – which again, is a completely novel thing.”

Alex is clearly looking forward to these further leaps into the unknown. “The PhD has been a real journey into lots of things that I don’t know, which is exciting. That’s really fun in and of itself.” However, when I ask him what his favourite part of this research has been so far, it isn’t the science. It’s the citizen scientists. He interacts with them directly through chat boards on the Zooniverse site, discussing findings and answering questions. Alex describes their enthusiasm as infectious – “We’re all excited about this unknown frontier together, and that has been really, really lovely.” He’s already busy preparing more data for the volunteers to examine, and who knows what they might find; they still have plenty of sky to explore.

A Sky Full of Chocolate Sauce: Citizen Science with Aurora Zoo

by Dr. Liz MacDonald and Laura Brandt

Viewing the aurora in person is a magnificent experience, but due to location (or pesky clouds) it’s not always an option. Fortunately, citizen science projects like Aurorasaurus and Zooniverse’s Aurora Zoo make it easy to take part in aurora research from any location with an internet connection. 

The Aurorasaurus Ambassadors group was excited to celebrate Citizen Science Month by inviting Dr. Daniel Whiter of Aurora Zoo to speak at our April meeting. In this post we bring you the highlights of his presentation, which is viewable in full here

To ASK the Sky for Knowledge

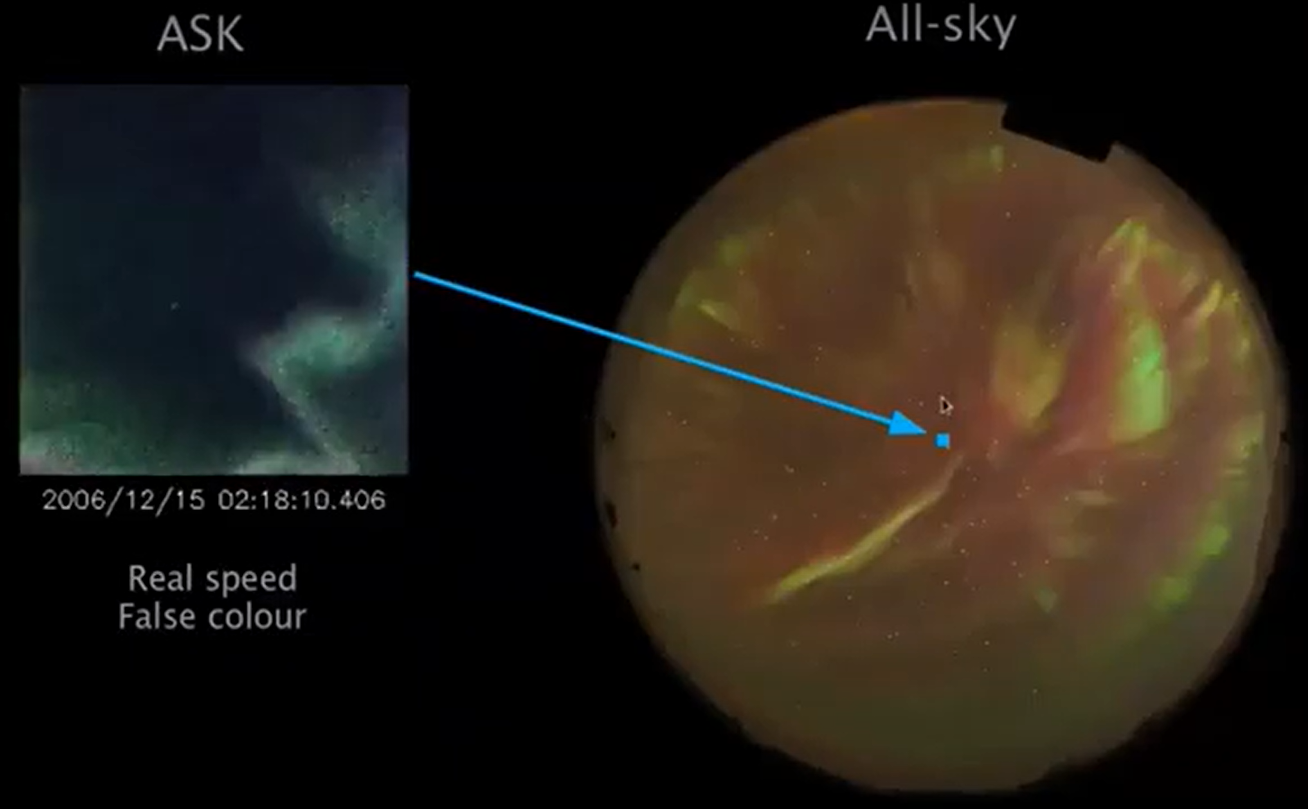
Far to the north on the Norwegian island of Svalbard, three very sensitive scientific cameras gaze at a narrow patch of sky. Each camera is tuned to look for a specific wavelength of auroral light, snapping pictures at 20 or 32 frames per second. While the cameras don’t register the green or red light that aurora chasers usually photograph, the aurora dances dynamically across ASK’s images. Scientists are trying to understand more about what causes these small-scale shapes, what conditions are necessary for them to occur, and how energy is transferred from space into the Earth’s atmosphere. ASK not only sees night-time aurora, but also special “cusp aurora” that occur during the day but are only visible in extremely specific conditions (more or less from Svalbard in the winter.)

Still from Dr. Whiter’s presentation. The tiny blue square on the allsky image (a fisheye photo looking straight up) represents the field of view of the ASK cameras. The cameras point almost directly overhead. 

The setup, called Auroral Structure and Kinetics, or ASK, sometimes incorporates telescopes, similar to attaching binoculars to a camera. Project lead Dr. Daniel Whiter says, “The magnification of the telescopes is only 2x; the camera lenses themselves already provide a small field of view, equivalent to about a 280mm lens on a 35mm full frame camera. But the telescopes have a large aperture to capture lots of light, even with a small field of view.”

The challenge is that ASK has been watching the aurora for fifteen years and has amassed 180 terabytes of data. The team is too small to look through it all for the most interesting events, so they decided to ask for help from the general public. 

Visiting the Aurora Zoo

Using the Zooniverse platform, the Aurora Zoo team set up a project with which anyone can look at short clips of auroras to help highlight patterns to investigate further. The pictures are processed so that they are easier to look at. They start out black and white, but are given “false color” to help make them colorblind-friendly and easier for citizen scientists to work with. They are also sequenced into short video clips to highlight movement. To separate out pictures of clouds, the data is skimmed by the scientists each day and run through an algorithm.

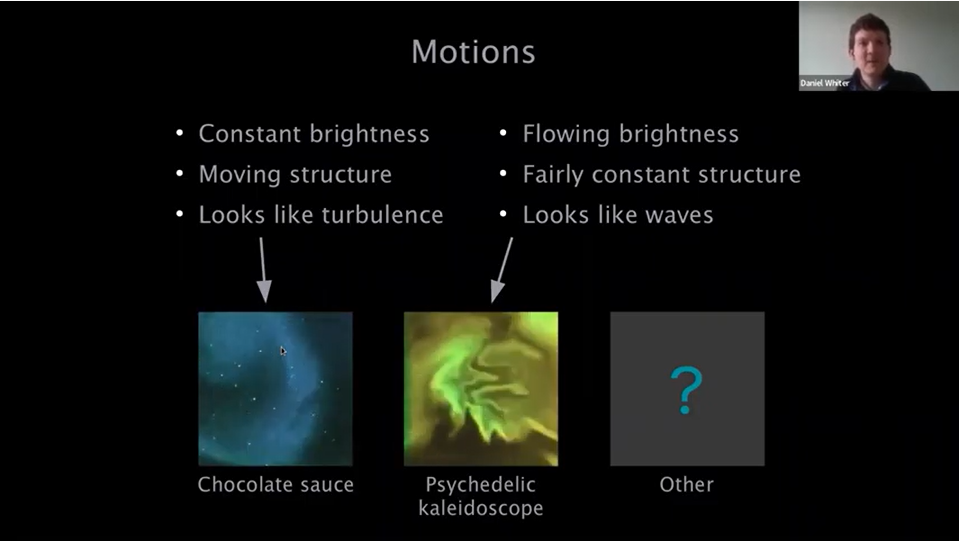
Aurora Zoo participants are then asked to classify the shape, movement, and “fuzziness,” or diffuse quality, of the aurora. STEVE fans will be delighted by the humor in some of the options! For example, two of the more complex types are affectionately called “chocolate sauce” and “psychedelic kaleidoscope.” So far, Aurora Zoo citizen scientists have analyzed 7 months’ worth of data out of the approximately 80 months ASK has been actively observing aurora. Check out Dr. Whiter’s full presentation for a walkthrough on how to classify auroras, and try it out on their website!

Some of the categories into which Zooniverse volunteers classify auroral movement. Credit: Dr. Daniel Whiter.

What can be learned from Aurora Zoo is different from other citizen science projects like Aurorasaurus. For example, when several arc shapes are close to one another, they can look like a single arc to the naked eye or in a photo, but the tiny patch of sky viewed through ASK can reveal them to be separate features. These tiny details are also relevant to the study of STEVE and tiny green features in its “picket fence”.

Early (Surprising!) Results

Aurora Zoo participants blew through the most recent batch of data, and fresh data is newly available. The statistics they gathered show that different shapes and movements occur at different times of day. For example, psychedelic kaleidoscopes and chocolate sauce are more common in the evening hours. The fact that the most dynamic forms show up at night rather than in the daytime cusp aurora reveals that these forms must be connected to very active aurora on the night side of the Earth. 

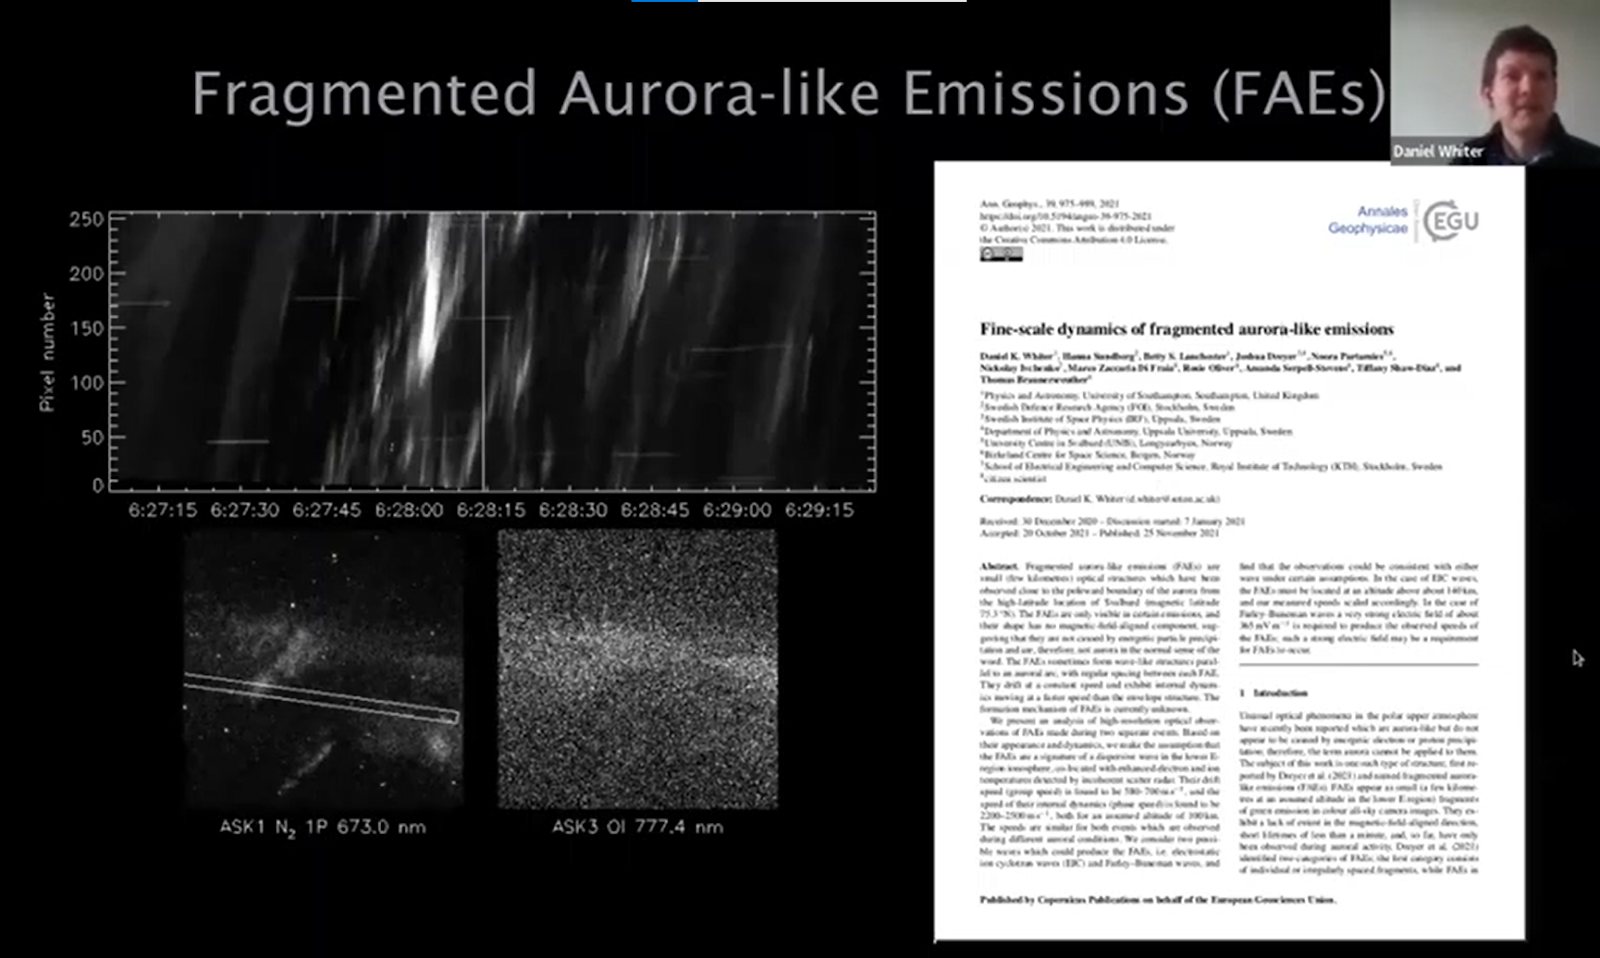
Aurora Zoo participants also notice other structures. Several noted tiny structures later termed “fragmented aurora-like emissions,” or FAEs. Because of the special equipment ASK uses, the team was able to figure out that the FAEs they saw weren’t caused by usual auroral processes, but by something else. They published a paper about it, co-authored with the citizen scientists who noticed the FAEs. 

Still from Dr. Whiter’s presentation, featuring FAEs and Aurora Zoo’s first publication.

What’s next? Now that Aurora Zoo has a lot of classifications, they plan to use citizen scientists’ classifications to train a machine learning program to classify more images. They also look forward to statistical studies, and to creating new activities within Aurora Zoo like tracing certain shapes of aurora. 

STEVE fans, AuroraZoo hasn’t had a sighting yet. This makes sense, because ASK is at a higher latitude than that at which STEVE is usually seen. However, using a similar small-field technique to examine the details of STEVE has not yet been done. It might be interesting to try and could potentially yield some important insights into what causes FAEs.

Citizen Science Month, held during April of each year, encourages people to try out different projects. If you love the beautiful Northern and Southern Lights, you can help advance real aurora science by taking part in projects like Aurora Zoo and Aurorasaurus

About the authors of this blog post: Dr. Liz MacDonald and Laura Brandt lead a citizen science project called Aurorasaurus. While not a Zooniverse project, Aurorasaurus tracks auroras around the world via real-time reports by citizen scientist aurora chasers on its website and on Twitter. Aurorasaurus also conducts outreach and education across the globe, often through partnerships with local groups of enthusiasts.  Aurorasaurus is a research project that is a public-private partnership with the New Mexico Consortium supported by the National Science Foundation and NASA. Learn more about NASA citizen science here

Grant’s Great Leaving Challenge

If you subscribe to our newsletters, the name “Grant” probably sounds familiar to you. Grant (our Project Manager and basically the ‘backbone of the Zooniverse’) has been with us for nearly 9 years, and with a heavy heart we’re sad to report he’s finally moving on to his next great adventure.

To mark his departure, we’ve announced “Grant’s Great Leaving Challenge”. The goal of this challenge is to collect 100,000 new classifications for the four Featured Projects on the homepage. Starting yesterday, if you submit at least 10 classifications total for these projects your name will automatically be entered to win one of three prizes. Importantly, you must be logged-in while classifying to be eligible for the draw. The challenge will end on Sunday, March 27th at midnight (GMT), and the winners will be announced on Tuesday, March 29th.

While we aren’t divulging what the prizes are, it might tempt you to hear that they’ll be personalised by Grant himself…

Read on to learn about the four featured projects, and what you can do to help them out.

Penguin Watch
Penguins – globally loved, but under threat. Research shows that in some regions, penguin populations are in decline; but why? Begin monitoring penguins to help us answer this question. With over 100 sites to explore, we need your help now more than ever!

Planet Hunters NGTS
The Next-Generation Transit Survey have been searching for transiting exoplanets around the brightest stars in the sky. We need your help sifting through the observations flagged by the computers to search for hidden worlds that might have been missed in the NGTS team’s review. Most of the planets in the dataset have likely been found already, but you just might be the first to find a new exoplanet not known before!

Dingo? Bingo!
The Myall Lakes Dingo Project aims to develop and test non-lethal tools for dingo management, and to further our understanding and appreciation of this iconic Australian carnivore. We have 64 camera-traps across our study site, and need your help to identify the animals they detect – including dingoes.

Weather Rescue at Sea
The aim of the Weather Rescue At Sea project is to construct and extended the global surface temperature record back to the 1780s, based on the air temperature observations recorded across the planet. This will be achieved by crowd-sourcing the recovery (or data rescue) of the weather observations from historical ship logbooks, station records, weather journals and other sources, to produce a longer, and more consistent dataset of global surface temperature.

Let’s send Grant off with a bang. Happy classifying!

Zooniverse Volunteers Discover More New Worlds

The volunteers on our Planet Hunters TESS project have helped discover another planetary system! The new system, HD 152843, consists of two planets that are similar in size to Neptune and Saturn in our own solar system, orbiting around a bright star that is similar to our own Sun. This exciting discovery follows on from our validation of the long-period planet around an evolved (old) star, TOI-813, and from our recent paper outlining the discovery of 90 Planet Hunters TESS planet candidates, which gives us encouragement that there are a lot more exciting systems to be found with your help!

Figure: The data obtained by NASA’s Transiting Exoplanet Survey Satellite which shows two transiting planets. The plot shows the brightness of the star HD 152843 over a period of about a month. The dips appear where the planets passed in front of the star and blocked some of its light from getting to Earth.


Multi-planet systems, like this one, are particularly interesting as they allow us to study how planets form and evolve. This is because the two planets that we have in this system must have necessarily formed out of the same material at the same time, but evolved in different ways resulting in the different planet properties that we now observe.


Even though there are already hundreds of confirmed multi-planet systems, the number of multi-planet systems with stars that are bright enough such that we can study them using ground-based telescopes remains very small. However, the brightness of this new citizen science found system, HD 152843, makes it an ideal target for follow-up observations, allowing us to measure the planet masses and possibly even probe their atmospheric composition.


This discovery was made possibly with the help of tens of thousands of citizen scientists who helped to visually inspect data obtained by NASA’s Transiting Exoplanet Survey Satellite, in the search for distant worlds. We thank all of the citizen scientists taking part in the project who continue to help with the discovery of exciting new planet systems and in particular to Safaa Alhassan, Elisabeth M. L. Baeten, Stewart J. Bean, David M. Bundy, Vitaly Efremov, Richard Ferstenou, Brian L. Goodwin, Michelle Hof, Tony Hoffman, Alexander Hubert, Lily Lau, Sam Lee, David Maetschke, Klaus Peltsch, Cesar Rubio-Alfaro, Gary M. Wilson, the citizen scientists who directly helped with this discovery and who have become co-authors of the discovery paper.


The paper has been published by the Monthly Notices of the Royal Astronomical Society (MNRAS) journal and you can find a version of it on arXiv at: https://arxiv.org/pdf/2106.04603.pdf.

Into the Zooniverse: Vol II now available!

For the second year in a row, we’re honoring the hundreds of thousands of contributors, research teams, educators, Talk moderators, and more who make Zooniverse possible. This second edition of Into the Zooniverse highlights another 40 of the many projects that were active on the website and app in the 2019 – 20 academic year.

Image of Into the Zooniverse book

In that year, the Zooniverse has launched 65 projects, volunteers have submitted more than 85 million classifications, research teams have published 35 papers, and hundreds of thousands of people from around the world have taken part in real research. Wow!

To get your copy of Into the Zooniverse: Vol II, download a free pdf here or order a hard copy on Blurb.com. Note that the cost of the book covers production and shipping; Zooniverse does not receive profit through sales. According to the printer, printing and binding take 4-5 business days, then your order ships. To ensure that you receive your book before December holidays, you can use this tool to calculate shipping times.

Read more at zooniverse.org/about/highlights.

SuperWASP Variable Stars – Update

The following is an update from the SuperWASP Vairable Stars research team. Enjoy!

Welcome to the Spring 2020 update! In this blog, we will be sharing some updates and discoveries from the SuperWASP Variable Stars project.

What are we aiming to do?

We are trying to discover the weirdest variable stars!

Stars are the building blocks of the Universe, and finding out more about them is a cornerstone of astrophysics. Variable stars (stars which change in brightness) are incredibly important to learning more about the Universe, because their periodic changes allow us to probe the underlying physics of the stars themselves.

We have asked citizen scientists to classify variable stars based on their photometric light curves (the amount of light over time), which helps us to determine what type of variable star we’re observing. Classifying these stars serves two purposes: firstly to create large catalogues of stars of a similar type which allows us to determine characteristics of the population; and secondly, to identify rare objects displaying unusual behaviour, which can offer unique insights into stellar structure and evolution.

We have 1.6 million variable stars detected by the SuperWASP telescope to classify, and we need your help! By getting involved, we can build up a better idea of what types of stars are in the night sky.

What have we discovered so far?

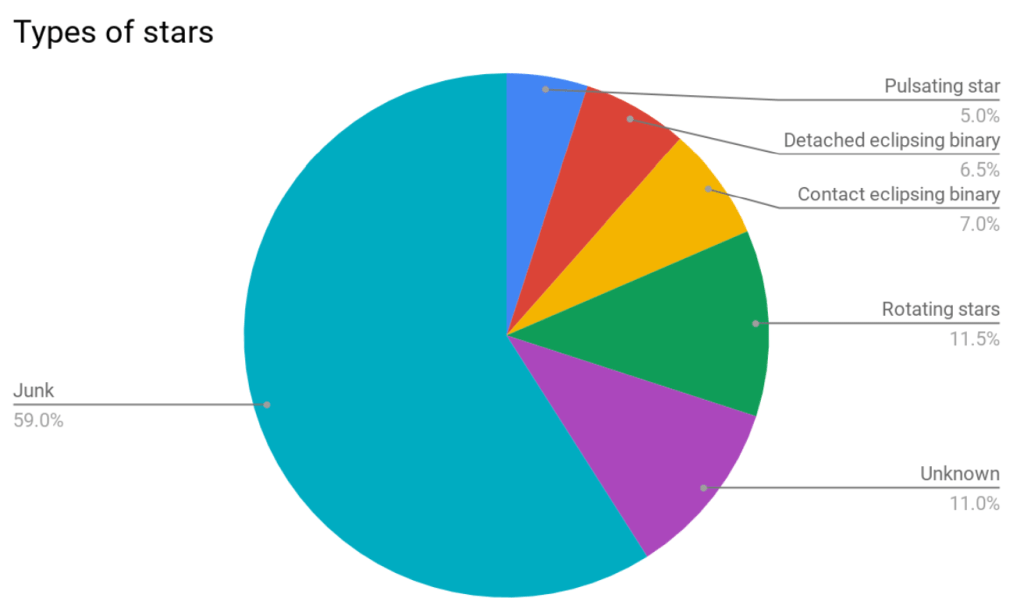
We’ve done some initial analysis on the first 300,000 classifications to get a breakdown of how many of each type of star is in our dataset.

So far it looks like there’s a lot of junk light curves in the dataset, which we expected. The programme written to detect periods in variable stars often picks up exactly a day or a lunar month, which it mistakes for a real period. Importantly though, you’ve classified a huge number of real and exciting light curves!

We’re especially excited to do some digging into what the “unknown” light curves are… are there new discoveries hidden in there? Once we’ve completed the next batch of classifications, we’ll do some more to see whether the breakdown of types of stars changes.

An exciting discovery…

In late 2018, while building this Zooniverse project, we came across an unusual star. This Northern hemisphere object, TYC-3251-903-1, is a relatively bright object (V=11.3) which has previously not been identified as a binary system. Although the light curve is characteristic of an eclipsing contact binary star, the period is ~42 days, notably longer than the characteristic contact binary period of less than 1 day.

Spurred on by this discovery, we identified a further 16 candidate near-contact red giant eclipsing binaries through searches of archival data. We were excited to find that citizen scientists had also discovered 10 more candidates through this project!

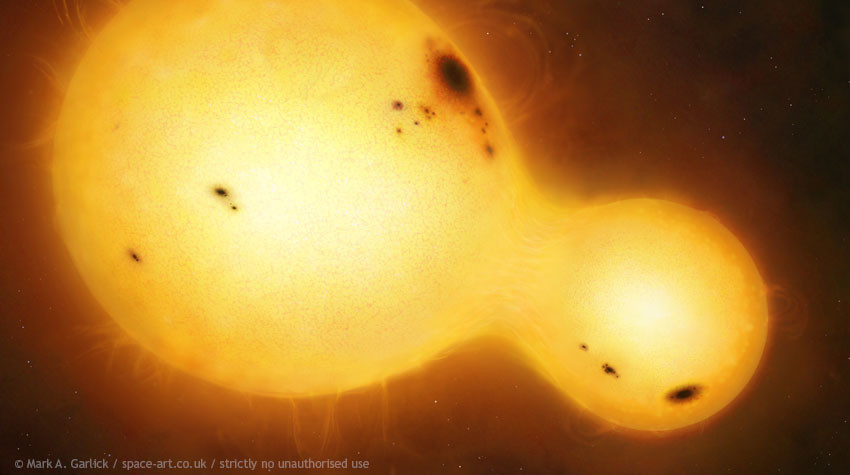
Figure 1: Artist’s impression of a contact binary star [Mark A. Garlick] Over the past 18 months, we’ve carried out an observing campaign of these 27 candidate binaries using telescopes from across the world. We have taken multi-colour photometry using The Open University’s own PIRATE telescope, and the Las Cumbres Observatory robotic telescopes, and spectroscopy of Northern candidates with the Liverpool Telescope, and Southern candidates using SALT. We’ve also spent two weeks in South Africa on the 74-inch telescope to take further spectroscopy.

Of the 10 candidate binaries discovered by citizen scientists, we were happy to be able to take spectroscopic observations for 8 whilst in South Africa, and we have confirmed that at least 2 are, in fact, binaries! Thank you citizen scientists!

Why is this discovery important?

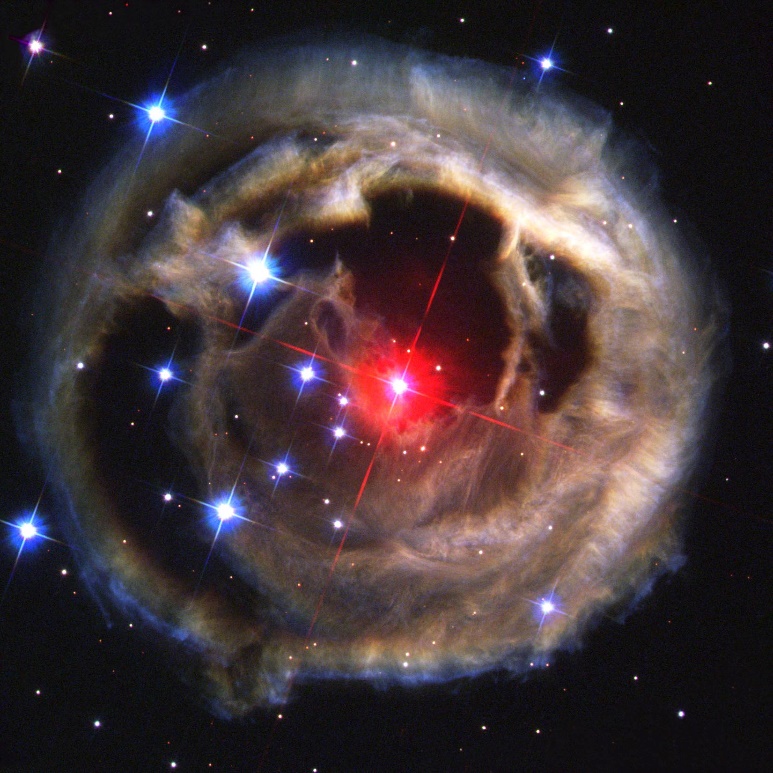
Figure 2: V838 Mon and its light echo [ESA/NASA]

The majority of contact or near-contact binaries consist of small (K/M dwarf) stars in close orbits with periods of less than 1 day. But for stars in a binary in a contact binary to have such long periods requires both the stars to be giant. This is a previously unknown configuration…

Interestingly, a newly identified type of stellar explosion, known as a red nova, is thought to be caused by the merger of a giant binary system, just like the ones we’ve discovered.

Red novae are characterised by a red colour, a slow expansion rate, and a lower luminosity than supernovae. Very little is known about red novae, and only one has been observed pre-nova, V1309 Sco, and that was only discovered through archival data. A famous example of a possible red nova is the 2002 outburst in V838 Mon. Astronomers believe that this was likely to have been a red nova caused by a binary star merger, forming the largest known star for a short period of time after the explosion.

So, by studying these near-contact red giant eclipsing binaries, we have an unrivalled opportunity to identify and understand binary star mergers before the merger event itself, and advance our understanding of red novae.

What changes have we made?

Since the SuperWASP Variable Stars Zooniverse project started, we’ve made a few changes to make the project more enjoyable. We’ve reduced the number of classifications needed to retire a target, and we’ve also reduced the number of classifications of “junk” light curves needed to retire it. This means you should see more interesting, real, light curves.

We’ve also started a Twitter account, where we’ll be sharing updates about the project, the weird and wacky light curves you find, and getting involved in citizen science and astronomy communities. You can follow us here: www.twitter.com/SuperWASP_stars

What’s next?

We still have thousands of stars to classify, so we need your help!

Once we have more classifications, we will be beginning to turn the results into a publicly available, searchable website, a bit like the ASAS-SN Catalogue of Variable Stars (https://asas-sn.osu.edu/variables). Work on this is likely to begin towards the end of 2020, but we’ll keep you updated.

We’re also working on a paper on the near-contact red giant binary stars, which will include some of the discoveries by citizen scientists. Expect that towards the end of 2020, too.

Otherwise, watch this space for more discoveries and updates!

We would like to thank the thousands of citizen scientists who have put time into this Zooniverse project. If you ever have any questions or suggestions, please get in touch.

Heidi & the SuperWASP Variable Stars team.

We Are Still here

These are strange times we live in. With many people ill or worried, and communities all over the world in lockdown or cutting out social contact in order to try and control the spread of the novel coronavirus, it’s hard to work out what the future holds.

The Zooniverse team – including our teams in Oxford and in Chicago – are all working from home, and we’re struggling to master how to communicate and work in this odd situation. So far we’ve encountered all sorts of weird glitches while trying to keep in touch.

Zoom backgrounds can be weird and terrifying, as demonstrated here by Sam.
Why am I the only one with a profile picture?

But we are still here! As we know lots of you are turning to Zooniverse for a distraction while your lives are disrupted, we’ve asked our research teams to pay particular attention to their projects and to be even more present online during this time. We’ll try and bring you more news from them over the next few weeks.

Anyway, if any of you would like to distract yourselves by taking part and contributing to one of our projects, we’ve made it easier to find a new project to dive into. The top of our projects page now highlights selected projects – they will change frequently, and might be topical, timely, particularly in need of your help – or just our favourites!

Zooniverse projects succeed because they’re the collective work of many thousands of you who come together to collaborate with our research teams – and a little bit of collective action in the world right now feels pretty good.

Look after yourselves, and see you in the Zooniverse.

Chris