Measuring Success in Citizen Science Projects, Part 2: Results

In the previous post, I described the creation of the Zooniverse Project Success Matrix from Cox et al. (2015). In essence, we examined 17 (well, 18, but more on that below) Zooniverse projects, and for each of them combined 12 quantitative measures of performance into one plot of Public Engagement versus Contribution to Science:

Public engagement vs Contribution to science : the success matrix
Public Engagement vs Contribution to Science for 17 Zooniverse projects. The size (area) of each point is proportional to the total number of classifications received by the project. Each axis of this plot combines 6 different quantitative project measures.

The aim of this post is to answer the questions: What does it mean? And what doesn’t it mean?

Discussion of Results

The obvious implication of this plot and of the paper in general is that projects that do well in both public engagement and contribution to science should be considered “successful” citizen science projects. There’s still room to argue over which is more important, but I personally assert that you need both in order to justify having asked the public to help with your research. As a project team member (I’m on the Galaxy Zoo science team), I feel very strongly that I have a responsibility both to use the contributions of my project’s volunteers to advance scientific research and to participate in open, two-way communication with those volunteers. And as a volunteer (I’ve classified on all the projects in this study), those are the 2 key things that I personally appreciate.

It’s apparent just from looking at the success matrix that one can have some success at contributing to science even without doing much public engagement, but it’s also clear that every project that successfully engages the public also does very well at research outputs. So if you ignore your volunteers while you write up your classification-based results, you may still produce science, though that’s not guaranteed. On the other hand, engaging with your volunteers will probably result in more classifications and better/more science.

Surprises, A.K.A. Failing to Measure the Weather

Some of the projects on the matrix didn’t appear quite where we expected. I was particularly surprised by the placement of Old Weather. On this matrix it looks like it’s turning in an average or just-below-average performance, but that definitely seems wrong to me. And I’m not the only one: I think everyone on the Zooniverse team thinks of the project as a huge success. Old Weather has provided robust and highly useful data to climate modellers, in addition to uncovering unexpected data about important topics such as the outbreak and spread of disease. It has also provided publications for more “meta” topics, including the study of citizen science itself.

Additionally, Old Weather has a thriving community of dedicated volunteers who are highly invested in the project and highly skilled at their research tasks. Community members have made millions of annotations on log data spanning centuries, and the researchers keep in touch with both them and the wider public in multiple ways, including a well-written blog that gets plenty of viewers. I think it’s fair to say that Old Weather is an exceptional project that’s doing things right. So what gives?

There are multiple reasons the matrix in this study doesn’t accurately capture the success of Old Weather, and they’re worth delving into as examples of the limitations of this study. Many of them are related to the project being literally exceptional. Old Weather has crossed many disciplinary boundaries, and it’s very hard to put such a unique project into the same box as the others.

Firstly, because of the way we defined project publications, we didn’t really capture all of the outputs of Old Weather. The use of publications and citations to quantitatively measure success is a fairly controversial subject. Some people feel that refereed journal articles are the only useful measure (not all research fields use this system), while others argue that publications are an outdated and inaccurate way to measure success. For this study, we chose a fairly strict measure, trying to incorporate variations between fields of study but also requiring that publications should be refereed or in some other way “accepted”. This means that some projects with submitted (but not yet accepted) papers have lower “scores” than they otherwise might. It also ignores the direct value of the data to the team and to other researchers, which is pretty punishing for projects like Old Weather where the data itself is the main output. And much of the huge variety in other Old Weather outputs wasn’t captured by our metric. If it had been, the “Contribution to Science” score would have been higher.

Secondly, this matrix tends to favor projects that have a large and reasonably well-engaged user base. Projects with a higher number of volunteers have a higher score, and projects where the distribution of work is more evenly spread also have a higher score. This means that projects where a very large fraction of the work is done by a smaller group of loyal followers are at a bit of a disadvantage by these measurements. Choosing a sweet spot in the tradeoff between broad and deep engagement is a tricky task. Old Weather has focused on, and delivered, some of the deepest engagement of all our projects, which meant these measures didn’t do it justice.

To give a quantitative example: the distribution of work is measured by the Gini coefficient (on a scale of 0 to 1), and in our metric lower numbers, i.e. more even distributions, are better. The 3 highest Gini coefficients in the projects we examined were Old Weather (0.95), Planet Hunters (0.93), and Bat Detective (0.91); the average Gini coefficient across all projects was 0.82. It seems clear that a future version of the success matrix should incorporate a more complex use of this measure, as very successful projects can have high Gini coefficients (which is another way of saying that a loyal following is often a highly desirable component of a successful citizen science project).

Thirdly, I mentioned in part 1 that these measures of the Old Weather classifications were from the version of the project that launched in 2012. That means that, unlike every other project studied, Old Weather’s measures don’t capture the surge of popularity it had in its initial stages. To understand why that might make a huge difference, it helps to compare it to the only eligible project that isn’t shown on the matrix above: The Andromeda Project.

In contrast to Old Weather, The Andromeda Project had a very short duration: it collected classifications for about 4 weeks total, divided over 2 project data releases. It was wildly popular, so much so that the project never had a chance to settle in for the long haul. A typical Zooniverse project has a burst of initial activity followed by a “long tail” of sustained classifications and public engagement at a much lower level than the initial phase.

The Andromeda Project is an exception to all the other projects because its measures are only from the initial surge. If we were to plot the success matrix including The Andromeda Project in the normalizations, the plot looks like this:

success matrix with the andromeda project making all the others look like public engagement failures
And this study was done before the project’s first paper was accepted, which it has now been. If we included that, The Andromeda Project’s position would be even further to the right as well.

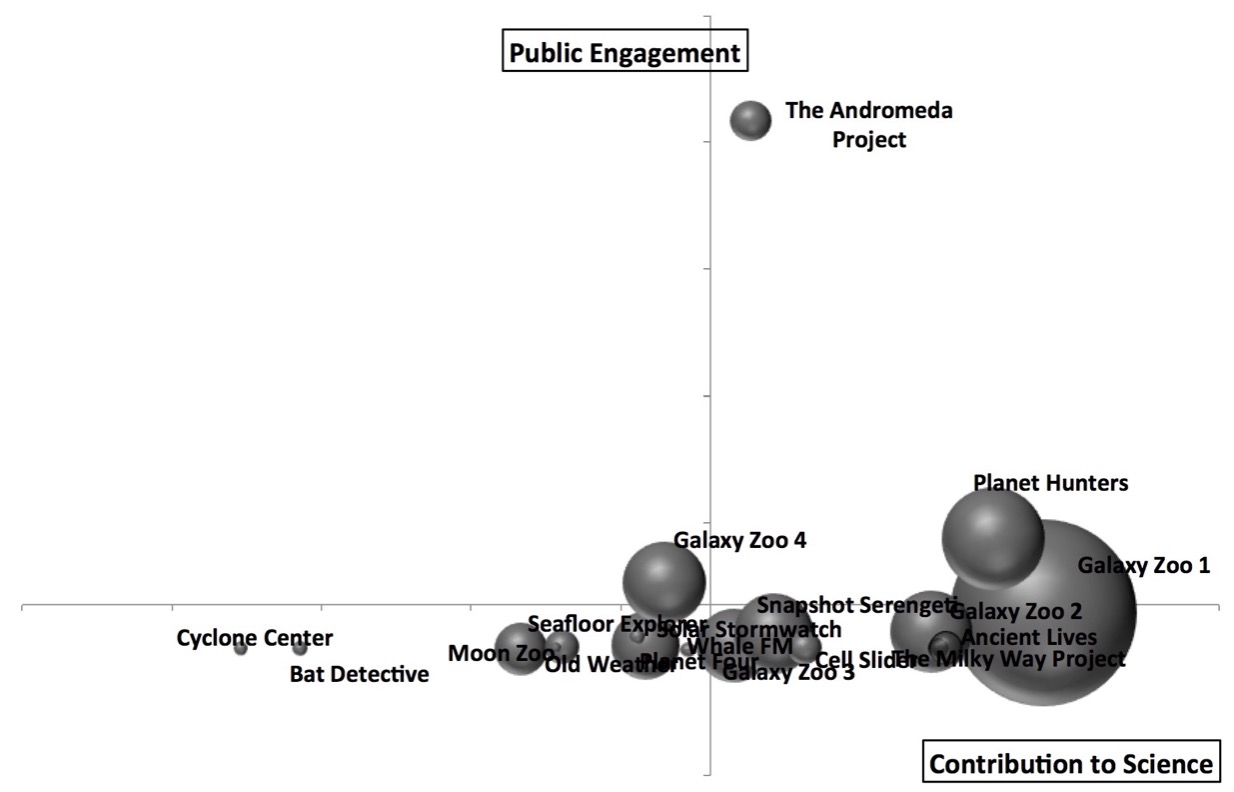
Because we try to control for project duration, the very short duration of the Andromeda Project means it gets a big boost. Thus it’s a bit unfair to compare all the other projects to The Andromeda Project, because the data isn’t quite the same.

However, that’s also true of Old Weather — but instead of only capturing the initial surge, our measurements for Old Weather omit it. These measurements only capture the “slow and steady” part of the classification activity, where the most faithful members contribute enormously but where our metrics aren’t necessarily optimized. That unfairly makes Old Weather look like it’s not doing as well.

In fact, comparing these 2 projects has made us realize that projects probably move around significantly in this diagram as they evolve. Old Weather’s other successes aren’t fully captured by our metrics anyway, and we should keep those imperfections and caveats in mind when we apply this or any other success measure to citizen science projects in the future; but one of the other things I’d really like to see in the future is a study of how a successful project can expect to evolve across this matrix over its life span.

Why do astronomy projects do so well?

There are multiple explanations for why astronomy projects seem to preferentially occupy the upper-right quadrant of the matrix. First, the Zooniverse was founded by astronomers and still has a high percentage of astronomers or ex-astronomers on the payroll. For many team members, astronomy is in our wheelhouse, and it’s likely this has affected decisions at every level of the Zooniverse, from project selection to project design. That’s starting to change as we diversify into other fields and recruit much-needed expertise in, for example, ecology and the humanities. We’ve also launched the new project builder, which means we no longer filter the list of potential projects: anyone can build a project on the Zooniverse platform. So I think we can expect the types of projects appearing in the top-right of the matrix to broaden considerably in the next few years.

The second reason astronomy seems to do well is just time. Galaxy Zoo 1 is the first and oldest project (in fact, it pre-dates the Zooniverse itself), and all the other Galaxy Zoo versions were more like continuations, so they hit the ground running because the science team didn’t have a steep learning curve. In part because the early Zooniverse was astronomer-dominated, many of the earliest Zooniverse projects were astronomy related, and they’ve just had more time to do more with their big datasets. More publications, more citations, more blog posts, and so on. We try to control for project age and duration in our analysis, but it’s possible there are some residual advantages to having extra years to work with a project’s results.

Moreover, those early astronomy projects might have gotten an additional boost from each other: they were more likely to be popular with the established Zooniverse community, compared to similarly early non-astronomy projects which may not have had such a clear overlap with the established Zoo volunteers’ interests.

Summary

The citizen science project success matrix presented in Cox et al. (2015) is the first time such a diverse array of project measures have been combined into a single matrix for assessing the performance of citizen science projects. We learned during this study that public engagement is well worth the effort for research teams, as projects that do well at public engagement also make better contributions to science.

It’s also true that this matrix, like any system that tries to distill such a complex issue into a single measure, is imperfect. There are several ways we can improve the matrix in the future, but for now, used mindfully (and noting clear exceptions), this is generally a useful way to assess the health of a citizen science project like those we have in the Zooniverse.

Note: Part 1 of this article is here.

Measuring Success in Citizen Science Projects, Part 1: Methods

What makes one citizen science project flourish while another flounders? Is there a foolproof recipe for success when creating a citizen science project? As part of building and helping others build projects that ask the public to contribute to diverse research goals, we think and talk a lot about success and failure at the Zooniverse.

But while our individual definitions of success overlap quite a bit, we don’t all agree on which factors are the most important. Our opinions are informed by years of experience, yet before this year we hadn’t tried incorporating our data into a comprehensive set of measures — or “metrics”. So when our collaborators in the VOLCROWE project proposed that we try to quantify success in the Zooniverse using a wide variety of measures, we jumped at the chance. We knew it would be a challenge, and we also knew we probably wouldn’t be able to find a single set of metrics suitable for all projects, but we figured we should at least try to write down one possible approach and note its strengths and weaknesses so that others might be able to build on our ideas.

The results are in Cox et al. (2015):

Defining and Measuring Success in Online Citizen Science: A Case Study of Zooniverse Projects

In this study, we only considered projects that were at least 18 months old, so that all the projects considered had a minimum amount of time to analyze their data and publish their work. For a few of our earliest projects, we weren’t able to source the raw classification data and/or get the public-engagement data we needed, so those projects were excluded from the analysis. We ended up with a case study of 17 projects in all (plus the Andromeda Project, about which more in part 2).

The full paper is available here (or here if you don’t have academic institutional access), and the purpose of these blog posts is to summarize the method and discuss the implications and limitations of the results. Continue reading Measuring Success in Citizen Science Projects, Part 1: Methods

Crowdsourcing and basic data visualization in the humanities

In late July I led a week-long course about crowdsourcing and data visualization at the Digital Humanities Oxford Summer School. I taught the crowdsourcing part, while my friend and collaborator, Sarah, from Google, lead the data visualization part. We had six participants from fields as diverse as history, archeology, botany and literature, to museum and library curation. Everyone brought a small batch of images, and used the new Zooniverse Project Builder (“Panoptes”) to create their own projects. We asked participants what were their most pressing research questions? If the dataset were larger, why would crowdsourcing be an appropriate methodology, instead of doing the tasks themselves? What would interest the crowd most? What string of questions or tasks might render the best data to work with later in the week?

Within two days everyone had a project up and running.  We experienced some teething problems along the way (Panoptes is still in active development) but we got there in the end! Everyone’s project looked swish, if you ask me.

Digging the Potomac

Participants had to ‘sell’ their projects in person and on social media to attract a crowd. The rates of participation were pretty impressive for a 24-hour sprint. Several hundred classifications were contributed, which gave each project owner enough data to work with.

But of course, a good looking website and good participation rates do not equate to easy-to-use or even good data! Several of us found that overly complex marking tasks rendered very convoluted data and clearly lost people’s attention. After working at the Zooniverse for over a year I knew this by rote, but I’d never really had the experience of setting up a workflow and seeing what came out in such a tangible way.

Despite the variable data, everyone was able to do something interesting with their results. The archeologist working on pottery shards investigated whether there was a correlation between clay color and decoration. Clay is regional, but are decorative fashions regional or do they travel? He found, to his surprise, that they were widespread.

In the end, everyone agreed that they would create simpler projects next time around. Our urge to catalogue and describe everything about an object—a natural result of our training in the humanities and GLAM sectors—has to be reined in when designing a crowdsourcing project. On the other hand, our ability to tell stories, and this particular group’s willingness to get to grips with quantitative results, points to a future where humanities specialists use crowdsourcing and quantitative methods to open up their research in new and exciting ways.

-Victoria, humanities project lead

Introducing the Planet Hunters Educators Guide

Julie A. Feldt is one of the educators behind Zooniverse.org. She first came to us in Summer 2013 as an intern at the Adler Planetarium to develop and test out Skype in the Classroom lessons and ended up joining the team the following winter. Julie was the lead educator in the development of the Planet Hunters Educators Guide.  Here she shares some information on the development and contents of this resource.

Screenshot 2015-07-06 14.49.53

In collaboration with NASA JPL, we have developed the Planet Hunters Educators Guide, which is 9 lessons aimed for use in middle school classrooms. This guide was developed for each lesson to build upon each other while also providing all the information needed  to do them alone. Teacher can choose to do one lesson on its own or the entire collection. Each lesson was planned out using the 5E method and to be accomplishable in a single 45 to 60 minute class period with some Evaluate sections as take home assignments. In development we focused on the science behind Planet Hunters and utilized JPL’s Exoplanet Exploration program and tools from PlanetQuest in order to connect with our partners in this field.

Through this guide, we want to introduce teachers and their classrooms to citizen science, exoplanet discovery, and how the science behind the Planet Hunters project is conducted. Lesson 1 starts by acquainting the class with what citizen science is and looking at several  projects, mostly outside of the Zooniverse. This lesson is great for teachers who just want to talk about citizen science in general and therefore it encompassesmany different types of citizen science projects. The rest of the lessons go into the understanding of exoplanets and using Planet Hunters in a classroom setting.

We wanted to give teachers the lessons they may need to build student understanding of the research and science done in Planet Hunters. Therefore, Lessons 2 through 5 focus on developing knowledge of possible life outside our solar system, the methods used to discover new worlds, and what makes those worlds habitable. For instance, in Lesson 2 students explore our own solar system with consideration of where life as we know it, directing them to the idea that there may be a habitable zone in our solar system. The students are asked to break up into groups to discuss how each of the planets compare with consideration of their location . We provided solar system information cards, see an example below, for students to be able to determine the conditions necessary for life as we know it to develop and survive.

Screenshot 2015-07-06 14.49.31Screenshot 2015-07-06 14.57.12

Lesson 6 is purely about getting students acquainted with Planet Hunters, specifically how to use it and navigate the website for information. This lesson can be great for the teachers that just want to show their students how they can be a part of real scientific research. After, students use the project data to find their own results and visuals on exoplanets found in Planet Hunters. Something to note, lesson 7 and 8 are pretty similar, but Lesson 8 incorporates a higher level of math for the more adventurous or older classrooms. Lesson 9 either wraps up the guide nicely or can be a fun activity to add to your science class where the students creativity and imagination comes out through designing what they believe a real exoplanet looks like, see summary from first page below.

Screenshot 2015-07-06 14.51.16

We hope our teachers enjoy using this product! We would love you hear how you have used it and any feedback that could be used in any future development of teacher guides for other projects.

A whole new Zooniverse

Anyone heading over to the Zooniverse today will spot a few changes (there may also be some associated down-time, but in this event we will get the site up again as soon as possible). There’s a new layout for the homepage, a few new projects have appeared and there’s a new area and a new structure to Talk to enable you to discuss the Zooniverse and citizen science in general, something we hope will bring together conversations that until now have been stuck within individual projects.

Our new platform, Panoptes, is name after Argus Panoptes, a many-eyed giant form Greek mythology.
Our new platform, Panoptes, is named after Argus Panoptes, a many-eyed giant form Greek mythology. Image credit: http://monsterspedia.wikia.com/wiki/File:Argus-Panoptes.jpg

What you won’t see immediately is that the site is running on a new version of the Zooniverse software, codenamed ‘Panoptes‘. Panoptes has been designed so that it’s easier for us to update and maintain, and to allow more powerful tools for project builders. It’s also open source from the start, and if you find bugs or have suggestions about the new site you can note them on Github (or, if you’re so inclined, contribute to the codebase yourself). We certainly know we have a lot more to do; today is a milestone, but not the end of our development. We’re looking forward to continuing to work on the platform as we see how people are using it.

Panoptes allows the Zooniverse to be open in another way too. At its heart is a project building tool. Anyone can log in and start to build their own Zooniverse-style project; it takes only a moment to get started and I reckon not much more than half an hour to get to something really good. These projects can be made public and shared with friends, colleagues and communities – or by pressing a button can be submitted to the Zooniverse team for a review (to make sure our core guarantee of never wasting people’s time is preserved), beta test (to make sure it’s usable!), and then launch.

We’ve done this because we know that finding time and funding for web development is the bottleneck that prevents good projects being built. For the kind of simple interactions supported by the project builder, we’ve built enough examples that we know what a good and engaging project looks like. We’ll still build new and novel custom projects helping the Zooniverse to grow, but today’s launch should mean a much greater number of engaging and exciting projects that will lead to more research, achieved more quickly.

We hope you enjoy the new Zooniverse, and comments and feedback are very welcome. I’m looking forward to seeing what people do with our new toy.

Chris

PS You can read more about building a project here, about policies for which projects are promoted to the Zooniverse community here and get stuck into the new projects at www.zooniverse.org/#/projects.

PPS We’d be remiss if we didn’t thank our funders, principally our Google Global Impact award and the Alfred P. Sloan Foundation, and I want to thank the heroic team of developers who have got us to this point. I shall be buying them all beer. Or gin. Or champagne. Or all three.

Orchids and Lab Rats

Orchid Observers, the latest Zooniverse project, is perhaps at first glance a project like all the others. If you visit the site, you’ll be asked to sort through records of these amazing and beguiling plants, drawn from the collections of the Natural History Museum and from images provided by orchid fans from across the country. There’s a scientific goal, related to identifying how orchid flowering times are changing across the UK, a potential indicator of the effects of climate change, and we will of course be publishing our results in scientific journals.

5550b1e921d72904e200003b

Yet the project is, we hope, also a pointer to one way of creating a richer experience for Zooniverse volunteers. While other projects, such as iNaturalist, have made great efforts in mobilizing volunteers to carry out data collection, this is the first time we’ve combined that sort of effort with ‘traditional’ Zooniverse data analysis. We hope that those in a position to contribute images of their own will also take part in the online phase of the project, both as classifiers but also sharing their expertise online – if you’re interested, there’s an article in the most recent BSBI News that team member Kath Castillo wrote to encourage that magazine’s audience to get involved in both phases of the project.

BSBI News – published by the Botanical Society of Britain and Ireland, and not as far as I know available online – is a common place for the environmental and naturalist communities to advertise citizen science projects in this way, and so it also serves as a place where people talk about citizen science. The same edition that contains Kath’s article also includes a piece by Kew research associate Richard Bateman chewing over the thorny issue of funding distributed networks of volunteers to participate (and indeed, to coordinate) projects like these. He alludes to the ConSciCom project in which we’re partners, and which has funded the development of both Orchid Observers and another Zooniverse project, Science Gossip, suggesting that we view volunteers as either a freely available source of expertise or, worse, as ‘laboratory rats’.

Neither rings true to me. While the work that gets done in and around Zooniverse projects couldn’t happen without the vast number of hours contributed by volunteers, we’re very conscious of the need to go beyond just passively accepting clicks. We view our volunteers as our collaborators – that’s why they appear on author lists for papers, and why when you take part in a Zooniverse project, then we should take on the responsibility of communicating the results back to you in a form that’s actually useful. The collaboration with the historians in ConSciCom, who study the 19th century – a time when the division between ‘professional’ and ‘citizen’ scientist was much less clear – has been hugely useful in helping us think this through (see, for example, Sally Frampton’s discussion of correspondence in the medical journals of the period). Similarly, it’s been great to work with the Natural History Museum who have a long and distinguished history in working with all sorts of naturalist groups. We’ve been working hard on directly involving volunteers in more than mere clickwork too, and ironically enough, the kind of collaboration with volunteer experts we hope to foster in Orchid Observers is part of the solution.

I hope you enjoy the new project – and as ever, comments and thoughts on how we can improve are welcome, either here or via the project’s own discussion space.

Chris

PS This debate is slightly different, but it reminds me of the discussions we’ve had over the years about whether ‘citizen’ science is actually science, or just mere clickwork. Here are some replies from 2010 and from 2013.

Disaster Response in Nepal and The Zooniverse

Very soon after the recent magnitude-7.8 earthquake in Nepal, we were contacted by multiple groups involved in directly responding with aid and rescue teams, asking if we could assist in the efforts getting underway to crowdsource the mapping of the region. One of those groups was Rescue Global, an independent reconnaissance charity that works across multiple areas of disaster risk reduction and response. Rescue Global also works with our collaborators in machine learning here at Oxford, combining human and computer inputs for disaster response in a project called Orchid. And they asked us to help them pinpoint the areas with the most urgent unfulfilled need for aid.

And so we sprang into action. The satellite company Planet Labs generously shared all its available data on Nepal with us. The resolution of Planet Labs’ imagery – about 5 metres per pixel – is perfect for rapid examination of large ground areas while showing enough detail to easily spot the signs of cities, farms and other settlements. After discussions with Rescue Global we decided to focus on the area surrounding Kathmandu, with a bias westward toward the quake epicentre, as much of this area is heavily populated but we knew many other, complementary efforts were focusing on the capital itself. We sliced about 13,000 km2 of land imagery into classifiable tiles, and created a new project using brand new Zooniverse software (coming very very soon!) that allows rapid project creation.

Screen Shot of the humanitarian project run by The Zooniverse for Orchid and Rescue Global
Once we had prepared the satellite images, we created the project in less than a day. Users were asked to indicate the strength of evidence of settlements in the area, and then how much of the image was classifiable.

We also realised that if we combined our work with the results of some of the aforementioned complementary efforts, we needn’t wait for the clouds to part so that we could get post-quake images. For example, the Humanitarian OpenStreetMap Team (HOT) is doing brilliant work providing exquisitely detailed maps for use in the relief efforts. But here’s the thing: Nepal is pretty big (larger than England). And accurate, detailed maps take time. So in the days immediately following the earthquake, our area of focus – which we already knew had been severely affected – hadn’t been fully covered by HOT yet. And by comparing rapid, broad classifications of a relatively large area of focus with the detailed maps of smaller areas provided by HOT efforts, we could still make very confident predictions about where aid would most be needed even with just pre-quake images.

Because our images were in the sweet spot of area coverage and resolution, we were able to classify the entire image set in just a couple of days with the combined effort of only about 25 people, comprising students and staff members from Oxford and Rescue Global staff. For each image, we asked each person about any visible settlements and about how “classifiable” the image was (sometimes there are clouds or artefacts).

After the classifications were collected, the machine learning team applied a Bayesian classifier combination code that we first used in the Zooniverse on the Galaxy Zoo: Supernova project. After comparing these results with the latest maps from the HOT team, we saw two towns that were outside the areas currently covered by other crisis mapping, but that our classifiers had marked as high priority.

map and satellite of 2 towns, 1 of which our classifications found quickly despite it not being mapped in detail.
Maps from OpenStreetMap (left) and satellite images from Planet Labs (right) for 2 regions in Nepal. The top area shows the Kathmandu Airport (already well mapped by other efforts) and the bottom shows a town southwest of Kathmandu that, at the time of Rescue Global’s request to us, had not yet been mapped.

We passed this on to Rescue Global, who have added it to the other information they have about where aid is urgently needed in Nepal. The relief efforts are now in a phase of recovery, cleanup, and ensuring the survivors have the basic necessities they need to carry on, like clean water and food. Now they are coping with the damage from the second earthquake too.

Those on the ground are still busy providing day-to-day aid, so it’s early days yet to properly characterise what impact we may have had, but the initial feedback has been very good. We will be analysing this project in the days and weeks to come to understand how we can respond even more rapidly and accurately next time. That likely includes much larger-scale projects where we will be calling on our volunteers to help with classification efforts. We believe the Zooniverse, Planet Labs, and partners like Rescue Global and Orchid (and QCRI, our partner on other in-the-works humanitarian projects) can make a unique and complementary contribution to the humanitarian and crisis relief sphere. We will keep you posted on the results of our Nepal efforts and those of other, future crises.

PS: This activity was carried out under a programme of, and funded by, the European Space Agency; we would also like to acknowledge our funders for the current Zooniverse platform as a whole, principally our Google Global Impact award and the Alfred P. Sloan Foundation. And, to our team of developers who worked so hard to make this happen: you rock.

Header image adapted from OpenStreetMap, © OpenStreetMap contributors.

Floating Forests: Teaching Young Children About Kelp

Today’s blog post comes from Fran Wilson,  a second grade teacher at Madeira Elementary School. Fran strives to promote an interest in science in her classroom and help students discover that not all scientists work in labs wearing white lab coats and safety goggles. She seeks meaningful opportunities for her students to participate in citizen scientist work to be responsible citizens, inspire future careers in science, and to connect science concepts to the real world.

This fall I decided to implement Zooniverse’s Floating Forests in my second grade classroom. As soon as I read the description of the project, I knew it was perfect for addressing both my state science and social studies standards dealing with interactions within habitats – living things impact the environment in which they live and the environment can also impact living things. The best part was that my students would be able to engage in meaningful work to acquire these concepts. I like to incorporate project-based learning whenever I can to allow my students to assume ownership of their learning and Floating Forests was no exception. My first challenge was determining how to introduce my students to the project when I didn’t even live anywhere close to an ocean.

Introducing the Problem by Integrating Curriculum

Sea otters are very cute! I decided to use second graders’ love for animals as the entry to the study of kelp. I believe that children learn efficiently when curriculum is integrated across content areas so I made a plan. I selected the book Sea Otters by Suzi Eszterhas. The text tells how a mother sea otter cares for her growing pup. The book’s full page color photos with just the right amount of text on each page made this an ideal book. I chose to begin with a language arts lesson. I projected the book onto my Smartboard and modeled a lesson on determining the main idea and details using a page of the text. Sea Otters does not contain subtitles so I told my students that determining the main idea for a page of text was like creating the subtitle to accompany a portion of text. My students eagerly participated in guided practice of this skill while oohing and aahing at the photos of the sea otters and becoming increasingly more intrigued with the information presented in the book.

By the time we finished reading the book, the children had seen the word kelp in the text and noticed the sea otters lounging on top of the ocean in a bed of kelp. It was the perfect time for me to pose some questions: What exactly is kelp? and Why is it important to the sea otter? My naturally curious students shared their thoughts and the interest in the sea otter and kelp escalated.

Shared Research

How can we learn about the sea otter and kelp?  That was the next question I posed after the groundwork was laid for engaging my students in collaborative research. Of course Sophia suggested that we find some more books on sea otters and Jon Miguel added that we should even find some on kelp. Tommaso proposed that we do an internet search to locate information on kelp. This planning step empowered my children with making the decisions about how to learn as well as reinforcing the steps a scientist might undergo while researching. Foreseeing my students’ plan, I had already checked out multiple books on sea otters written at various readability levels along with the few books on kelp that I was able to find.

I selected the book Sea Otters by Laura Marsh to read aloud next to my students. This enabled them to compare the information presented in two books on sea otters.   My students listened closely to identify the facts from the text that highlighted the importance of kelp to the sea otters. I started a large chart titled “Sea Otters and Kelp Facts” and modeled how to take notes for our shared research. After reading aloud each of our class notes, the students decided that they had learned some ways in which sea otters depended on kelp but that they still didn’t know much about kelp. At that point we started our internet search.

The Floating Forests webpage provides some great resources, even for use with second graders! Under the education tab of the site, I found a link to a video produced by NOAA to introduce the kelp forest to my students. I was excited that one of my students suggested that they should take notes about kelp in their science journals. (I so love when they take the initiative in their learning!). I discovered several other informative, kid friendly sites with information and videos that we viewed in class and my students continued to take notes. After watching the videos Miki suddenly made the connection and proclaimed, “Hey we eat kelp at my house!” The next day she brought kelp in for everyone in the class to taste.

Websites for Learning about Kelp:

  1. Here is a great introductory site to begin the study of kelp. At this link students can view a video of the kelp habitat created by NOAA. My students were in awe after viewing the video. (Ok I’ll admit I probably let them watch it at least 5 times and each time the students took away new facts!) https://www.youtube.com/watch?v=GcbU4bfkDA4
  2. This website provides information about the kelp forest habitat and the animals which live among the kelp. The kids loved taking the quiz at the end after reading the information on the site.  http://web.calstatela.edu/faculty/eviau/edit557/oceans/norma/oklpfst.htm
  3. The following website supplies lots of information for children to learn more about kelp and its uses. http://aquarium.ucsd.edu/Education/Learning_Resources/Voyager_for_Kids/kelpvoyager/
  4. This video about the disappearing kelp forests in Tasmania prompted my students to think about the need to protect kelp habitats. https://www.youtube.com/watch?v=eRfxFZ4ndlg
  5. Here is a link to a Dragonfly episode in which kids dive to explore sea life at different depths of the kelp forest. http://pbskids.org/dragonflytv/show/kelpforest.html

Books for Learning About Sea Otters and Kelp:

  1. Baker, Jeannie. The Hidden Forest. New York: Greenwillow Books, 2000.  This story of two children retrieving a fish trap off the eastern coast of Tasmania helps children to see the kelp forest with wonder and appreciation. The author’s note at the end of the book offers insight to this disappearing kelp forest.
  2.  Douglas, Lloyd. Kelp. New York: Scholastic, 2005.  This simple book presents facts about the kelp forest. It’s perfect for lower level readers.
  3. Eszterhas, Suzi. Sea Otter. New York: Frances Lincoln Children’s Books, 2013.  Readers can learn how a mother sea otter cares for her pup from birth until she is grown up.
  4. Marsh, Laura. Sea Otters. Des Moines, IA: National Geographic Children’s Books, 2014.  This informative book contains interesting facts on sea otters and is accompanied by colorful photos.
  5. Slade, Suzanne. What If There Were No Sea Otters?: A Book about the Ocean Ecosystem. North Mankato, MN: Picture Window Books, 2011.  This book enables children to see the importance of the sea otter as a “keystone species” in the kelp habitat. It explores the food chain and how the plants and animals of this ecosystem are connected to one another.
  6. Tatham, Betty. Baby Sea Otter. New York: Henry Holt and Company, 2005.  A mother sea otter protects and cares for her pup until it is able to care for itself.
  7. Wu, Norbert. Beneath the Waves: Exploring the Hidden World of the Kelp Forest. San Franciso, CA: Chronicle Books, 1992.  Children will be intrigued by the photos of the kelp forest and the animals that live in it while checking out this book. It is a more complex text that children will need guidance to read.

Compiling the Research:

What a list of kelp facts my students generated! After reading and researching about kelp on the internet, I compiled all of their facts onto our classroom chart. I sensed my students’ enthusiasm towards learning and researching but this was confirmed when I opened my email the next morning from a parent.

Sonia's note to her mom. Dear Mom, I missed you when you were at your art class. Today at school we learned about kelp. Did you know kelp is good to eat? And it can help you if you’re ill. And kelp has gas inside of it. The gas is stored inside big round leaves. These leaves are called sword leaves. Kelp is used in toothpaste and shampoo. And so many other things too. Love, Sonia
Sonia’s note to her mom.
Dear Mom,
I missed you when you were at your art class. Today at school we learned about kelp. Did you know kelp is good to eat? And it can help you if you’re ill. And kelp has gas inside of it. The gas is stored inside big round leaves. These leaves are called sword leaves. Kelp is used in toothpaste and shampoo. And so many other things too.
Love,
Sonia

What should we do with all of these facts? That was the next question I posed.   Addy had the answer to that and she shared that the facts should be placed into categories. I cut apart all of the kelp facts on the chart and we laid them out in our meeting area. The students quickly sorted the facts into categories. Some of these categories included: What is kelp, Parts of kelp, Kelp forests, Animals that live in kelp, Fish and the kelp forest, Sea otters and kelp, and Scientists and kelp. Next, some children volunteered to work in small groups to write the information into a paragraph with a main idea sentence and details. (Yay! This writing linked back to the initial reading of text for main ideas and key details.). Other children volunteered to illustrate the text with crayons and watercolors. The class research on kelp was almost finished until we started…

Discovering the Ecosystem:

Extending learning across the curriculum is really important to me so while the children were working collaboratively to research kelp through viewing websites and the few books I found, I was meeting with guided reading groups to read and discuss books on ocean life. The children began to think about the ocean as a habitat for many animals and the kelp forest as a very important habitat! After sharing the book What if There Were No Sea Otters?: A Book About the Ocean Ecosystem by Suzanne Slade with a small group of children, Ben announced, “I get it!   It’s all connected like a big puzzle!” Kalley latched onto the term “keystone species” highlighted for the sea otters in the text and Sonia explained the relationship between the sea otter and the kelp in the ocean habitat.

All these relationships between the many sea animals in the kelp habitat had the children talking. We needed to solidify their thoughts in a way that we could see them. That’s when the children created a giant model of a kelp habitat. The kelp stalks grew quickly on the large blue poster paper while sea otters were being drawn in a corner of the room, prickly purple and red sea urchins were crafted, fish with fins formed, and kelp labels were created. Of course a new page was added to the children’s book on kelp. Now it was time to publish!

A digital story was created with all of the children’s research. I scanned the children’s writing along with their illustrations. I used Keynote and placed each of the children’s pages of text onto a slide. A small group of children were recorded reading the text upon the slides. The keynote was then exported as an iMovie. We posted the individual pages of the children’s kelp research in the hall for all the other students of our school to enjoy. I submitted the digital story to the Floating Forest blog. Here is the link to view my students’ digital informational book on kelp: http://blog.floatingforests.org
A digital story was created with all of the children’s research. I scanned the children’s writing along with their illustrations. I used Keynote and placed each of the children’s pages of text onto a slide. A small group of children were recorded reading the text upon the slides. The keynote was then exported as an iMovie. We posted the individual pages of the children’s kelp research in the hall for all the other students of our school to enjoy. I submitted the digital story to the Floating Forests blog. Here is the link to view my students’ digital informational book on kelp.

Finding Kelp on Floating Forests

It was finally the right time! My students knew about kelp and understood what an important habitat it was for many sea creatures. Now was the time for sharing Zooniverse’s Floating Forests project with my class.   Do you think you’d like to help some scientists with a special project on kelp? I asked. My students were SO excited to become involved. They were even more excited when they realized that they would be looking for kelp on real satellite photos taken from space!

First, I prepared for the children’s “official training.” I connected my computer to my Smartboard and the children viewed the brief tutorial on the Floating Forests website. They quickly learned how to classify the satellite photos and circle the kelp. We circled hundreds of photos together and each time they spotted kelp they became very excited.

Circling kelp on the Floating Forests website continues to be a favorite classroom activity. My students enjoy working in teams of two or three on an iPad taking turns to mark the satellite photos. They often keep a tally of how many times they identified kelp on a photo. I love the discussion it prompts among teams of children circling photos. Through their work, they’ve learned that kelp is found near coastlines. They’re intrigued with the places in the world that kelp might be found.

Participating as citizen scientists with the Floating Forest Project has enabled my students to engage in meaningful work. They feel responsible contributing to important scientific research. My students know that some of the kelp forests are disappearing and they are genuinely concerned. This work has made them more interested in their world and has instilled a need to work collaboratively to care for our earth. My students’ interest in science has been fostered and perhaps some of them will even be inspired to become scientists. I feel like my students have gained so much from this learning opportunity but perhaps it’s what they think that counts most.

Student Responses to Floating Forests

Screen Shot 2015-04-28 at 3.47.24 PM
Some student reactions to Floating Forests
Screen Shot 2015-04-28 at 3.47.10 PM

The Science of Citizen Science: Meetings in San Jose This Week

I and other Galaxy Zoo and Zooniverse scientists are looking forward to the Citizen Science Association (CSA) and American Association for the Advancement of Scientists (AAAS) meetings in San Jose, California this week.

As I mentioned in an earlier post, we’ve organized an AAAS session that is titled, “Citizen Science from the Zooniverse: Cutting-Edge Research with 1 Million Scientists,” which will take place on Friday afternoon. It fits well with the AAAS’s them this year: “Innovations, Information, and Imaging.” Our excellent line-up includes Laura Whyte (Adler) on Zooniverse, Brooke Simmons (Oxford) on Galaxy Zoo, Alexandra Swanson (U. of Minnesota) on Snapshot Serengeti, Kevin Wood (U. of Washington) on Old Weather, Paul Pharoah (Cambridge) on Cell Slider, and Phil Marshall (Stanford) on Space Warps.

And in other recent Zooniverse news, which you may have heard already, citizen scientists from the Milky Way Project examined infrared images from NASA’s Spitzer Space Telescope and found lots of “yellow balls” in our galaxy. It turns out that these are indications of early stages of massive star formation, such that the new stars heat up the dust grains around them. Charles Kerton and Grace Wolf-Chase have published the results in the Astrophysical Journal.

But let’s get back to the AAAS meeting. It looks like many other talks, sessions, and papers presented there involve citizen science too. David Baker (FoldIt) will give plenary lecture on post-evolutionary biology and protein structures on Saturday afternoon. Jennifer Shirk (Cornell), Meg Domroese and others from CSA have a session Sunday morning, in which they will describe ways to utilize citizen science for public engagement. (See also this related session on science communication.) Then in a session Sunday afternoon, people from the European Commission and other institutions will speak about global earth observation systems and citizen scientists tackling urban environmental hazards.

Before all of that, we’re excited to attend the CSA’s pre-conference on Wednesday and Thursday. (See their online program.) Chris Filardi (Director of Pacific Programs, Center for Biodiversity and Conservation, American Museum of Natural History) and Amy Robinson (Executive Director of EyeWire, a game to map the neural circuits of the brain) will give the keynote addresses there. For the rest of the meeting, as with the AAAS, there will be parallel sessions.

The first day of the CSA meeting will include: many sessions on education and learning at multiple levels; sessions on diversity, inclusion, and broadening engagement; a session on defining and measuring engagement, participation, and motivations; a session on CO2 and air quality monitoring; a session on CS in biomedical research;
and sessions on best practices for designing and implementing CS projects, including a talk by Chris Lintott on the Zooniverse and Nicole Gugliucci on CosmoQuest. The second day will bring many more talks and presentations along these and related themes, including one by Julie Feldt about educational interventions in Zooniverse projects and one by Laura Whyte about Chicago Wildlife Watch.

I also just heard that the Commons Lab at the Woodrow Wilson Center is releasing two new reports today, and hardcopies will be available at the CSA meeting. One report is by Muki Haklay (UCL) about “Citizen Science and Policy: A European Perspective” and the other is by Teresa Scassa & Haewon Chung (U. of Ottawa) about “Typology of Citizen Science Projects from an Intellectual Property Perspective.” Look here for more information.

In any case, we’re looking forward to these meetings, and we’ll keep you updated!

Using Tag Groups to Collect Images on Talk

Hashtags are an important element of how the current generation of Zooniverse’s Talk discussion system* helps to power citizen science. By adding hashtags to the short comments left directly on classification objects, users can help each other (and the science teams) find certain types of objects—for instance, a #leopard on Snapshot Serengeti, #frost on Planet Four, or a #curved-band on Cyclone Center. (As on Twitter, hashtags on Talk are generated using the # symbol.)

One of the ways in which zooites can take advantage of hashtags is by using Talk’s tag group feature. A tag group (also called a “keyword collection”) is a collection that automatically populates with all of the objects that have been given a specific hashtag by a volunteer.

For instance, here is a Galaxy Zoo tag group that populates with all Galaxy Zoo objects that have been tagged #starforming. It will continue to automatically add new images that are given the #starforming tag as well.

Screen Shot 2015-01-14 at 10.48.28 AM

There are two ways to tell that this is a tag-group collection, not a manually curated one. The first is that the fourth letter in the last part of the URL (CGZL000056) is an L, for “live” collection. (The other type will have an S as the fourth letter, for “static” collection.) The second is that under “description,” the conditions for the tag group will be displayed: what tags it includes and excludes.

Users can create a tag group in either of two ways: 1. Click the “create a tag group” button that will appear underneath the “tags” on the right side of any object page that has at least one hashtag (and then edit the conditions to their liking), or 2. Add “/#/collections/new/keywords/” to the end of the Talk URL; for instance, talk.planktonportal.org/#/collections/new/keywords/

Screen Shot 2015-01-14 at 10.57.11 AM

At this point, there is no way to create a collection that includes, say, on Operation War Diary, #casualty or #sniper—only objects that have #casualty and #sniper. You can, however, exclude certain tags: e.g., all #casualty objects not also tagged #sniper, or #casualty and #sniper but no #horses.

Screen Shot 2015-01-14 at 10.55.31 AM

Also, please note that, like all collections, these tag groups are currently capped at 500 total visible images.

It is likely that the next generation of Talk (currently being built) will feature a more refined method of curating collections from hashtags, as well as a more effective search functionality. For now, however, zooites should keep the tag group feature in mind… especially as it will be a critical feature of an upcoming project!

* As of January 2015, the Zooniverse projects using the most recent generation of Talk are: Galaxy Zoo, Planet Hunters, Operation War Diary, Milky Way Project, Snapshot Serengeti, Planet Four, Galaxy Zoo Radio, Asteroid Zoo, Disk Detective, Sunspotter, Cyclone Center, Plankton Portal, Notes from Nature, Condor Watch, Floating Forests, Penguin Watch, Worm Watch Lab, Higgs Hunters, and Chicago Wildlife Watch.

The world's largest and most popular platform for people-powered research. This research is made possible by volunteers—millions of people around the world who come together to assist professional researchers.