In this edition of Who’s who in the Zoo, meet Patricia, Community Manager of the Science Scribbler organisation.
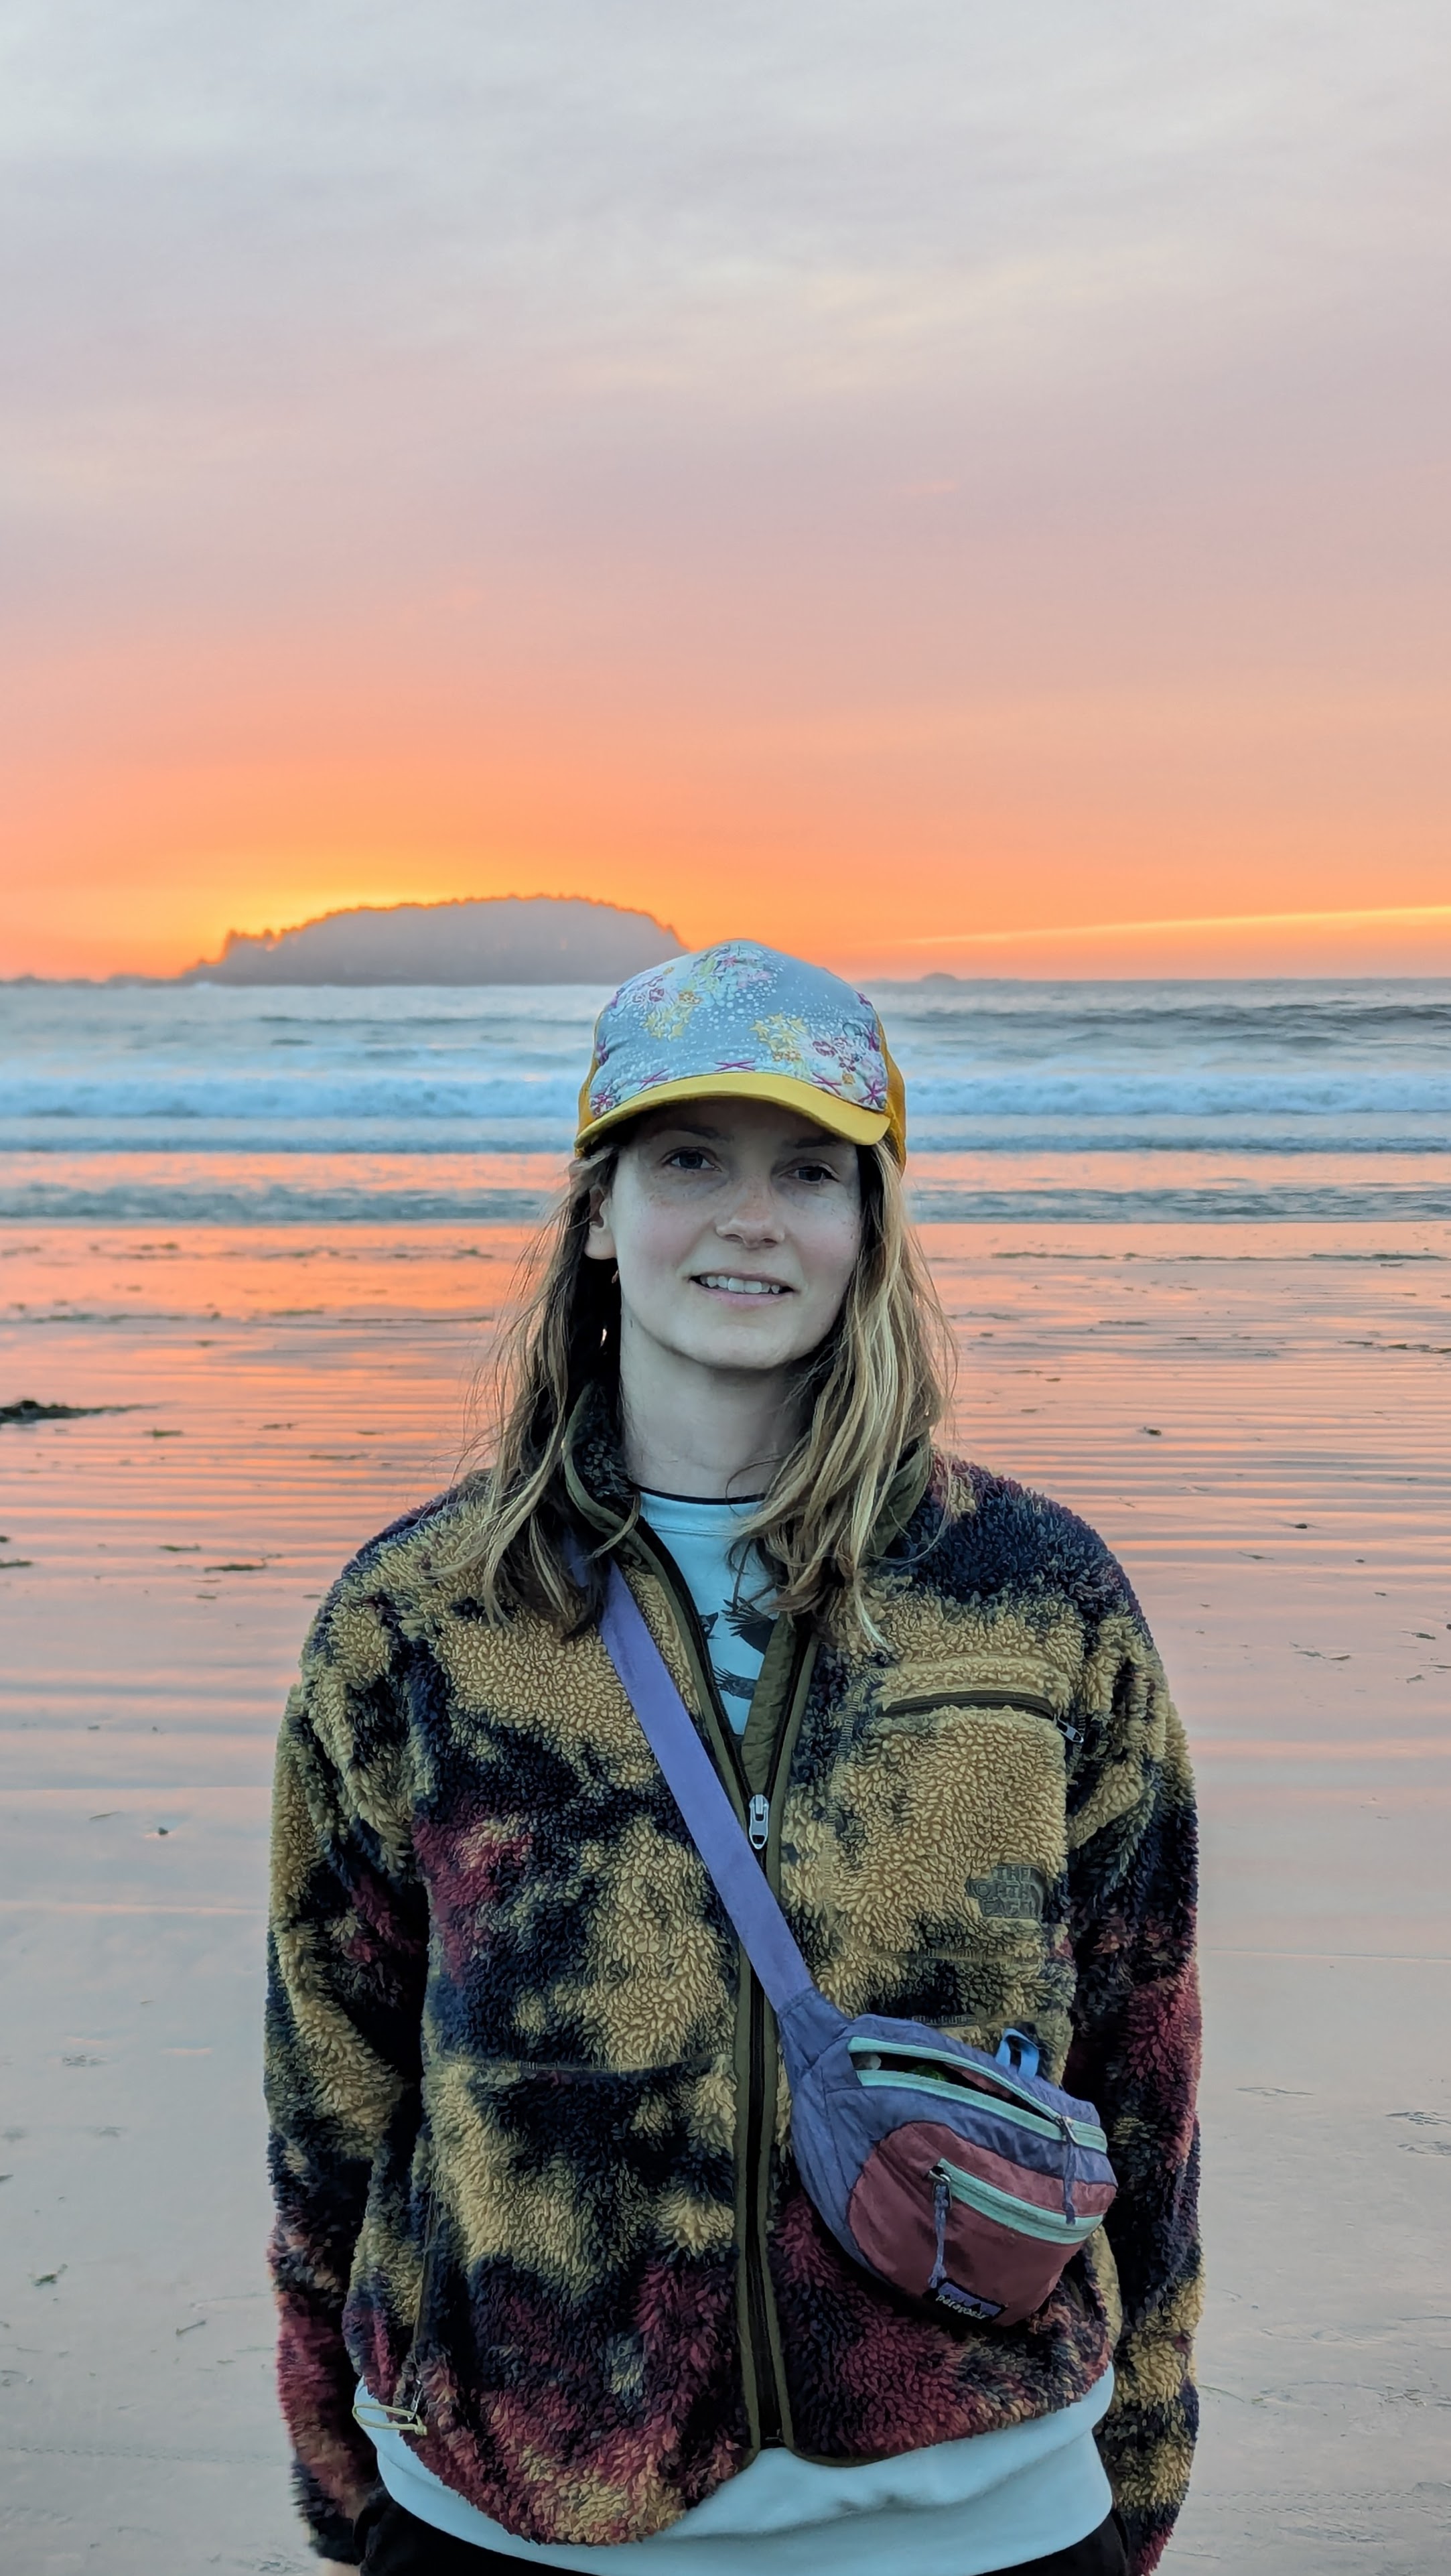
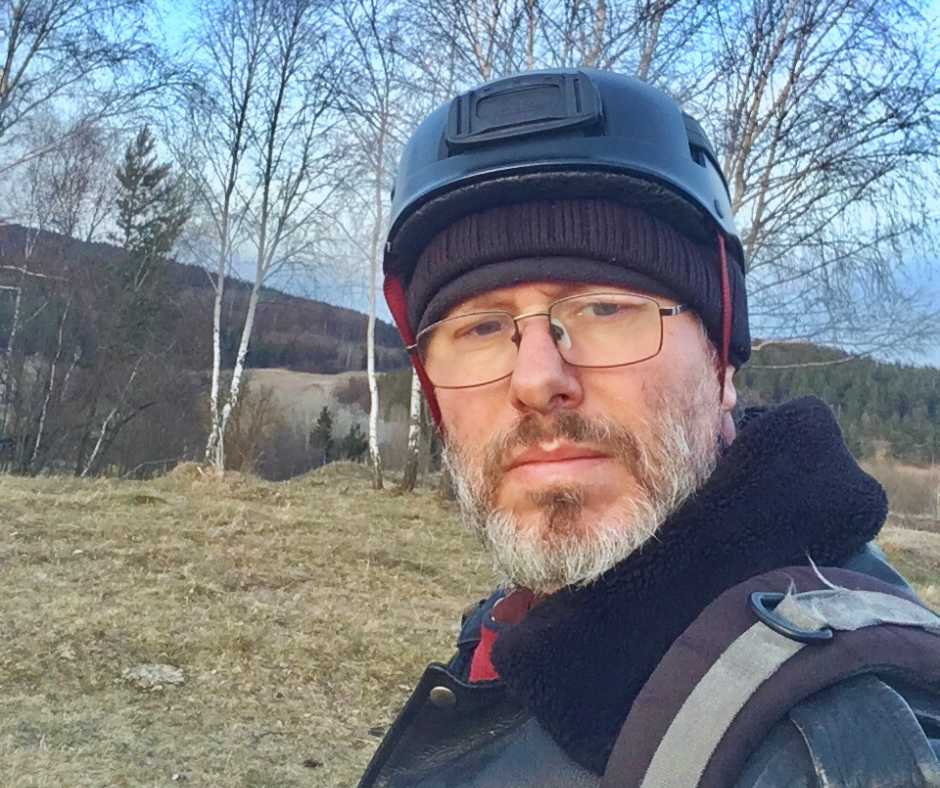
Who: Patricia Smith, Community Manager
Location: The Rosalind Franklin Institute, Harwell Campus, Oxfordshire, UK
Zooniverse project: The Science Scribbler organisation
(photo credit: Ryan Cowan)
What is your research about?
As a community manager, I wear a lot of different hats! My formal background is materials science and biomaterials, but I’m now the ‘citizen science specialist’ in a lot of my day-to-day research. I work alongside imaging specialists, software engineers, and experts in a variety of biosciences to help them design interesting, effective, and worthwhile projects on the Zooniverse. Essentially, I make sure that the experts are asking the right questions, in the right way, for our volunteers to be able to understand and contribute most effectively to our research.
I also spend a lot of time supporting our Science Scribbler community and making sure our volunteers are the first to hear about any project updates or research outcomes. The rest of my time is spent working with teachers to support them in using citizen science in the classroom through our Virus Factory in Schools project, and dabbling in a little bit of my own research too.
How do Zooniverse volunteers contribute to your research?
Most of the Science Scribbler projects launched so far have focused on 3D biological imaging data. When we ask questions about a particular sub-cellular structure or disease, we usually have to go through a process called segmentation: essentially colouring in every pixel that we count as being part of a particular class or label. Automated segmentation methods are constantly improving, but most of the time they still require a lot of expert annotation to either train or finetune the segmentation model. Creating this annotation is a huge bottleneck in processing all the data we collect. As a consequence, we usually have to compromise in some way: looking at a smaller sample size or asking less complicated questions.
Where volunteers help us in our research is in providing the annotations we need to train or refine our segmentation models. Once we have segmentation models that are working well, we can start to ask the really interesting questions – like what differences can we see in the mitochondria of healthy or diseased placenta? And what does that mean for our understanding of that disease?
But using citizen science to train or finetune our models isn’t just about passing the workload from a researcher to the crowd – it’s so much more powerful than that. One thing I’m really interested in is how citizen science can impact the bias in our models. If one expert trains a model, it will ‘see’ what that one individual sees. But if a model is trained on thousands of eyes through citizen science, it has the potential to be less biased than the expert, and who knows what that will bring!
What’s a surprising or fun fact about your research field?
We collect a lot of data at the Rosalind Franklin Institute. Recently we celebrated reaching 1 petabyte of Franklin data with a petabyte party (yes, there was cake). A petabyte is one million gigabytes – a huge amount of data for anyone to analyse – hence why we know citizen science is so valuable in our research. But what astounds me is how biology is at a completely different level; you can store roughly 215 petabytes of data in just 1 gram of DNA. Mind: blown.
What first got you interested in research?
I’m very lucky that I was exposed to a lot of science and engineering from a very early age. I think I decided I’d be a biochemist when I was just 9 years old, but in the end materials science stole my heart! There’s something fundamentally rewarding about being able to look at my everyday environment and ask: “How does this work?”, “What is this made of?” and most importantly “Why????”
In my role I’ve learned a lot about the impact science capital can have on a child’s attitude towards science and STEM careers. It’s part of why I think science communication is so important, and why I chose to work in a position that allows me to share my love of science with so many people.
What’s something people might not expect about your job or daily routine?
We livestream citizen science on Twitch!
Outside of work, what do you enjoy doing?
I really enjoy hiking and skiing in the alps, DnD, board games, and a good flat white. I also spent a decade dedicating half my time to rowing – when I started this role I was working part-time alongside training as a full-time athlete.
What are you favourite citizen science projects?
Too many to count! I’m always very nosey when a new project launches on the Zooniverse, so I try to submit at least a few classifications for each one. I really like using the Zooniverse app, so Gwitch Hunters comes to mind there. I also really enjoy the Etch A Cell projects, HMS NHS, and Monkey Health Explorer. The first project I contributed to was Civil War Bluejackets. Following the progress on the project over the last 3 years has been really easy thanks to their amazing blog and newsletters. They recently moved from full transcription (which I did a lot of) to correcting the automated transcriptions that were trained on our original work. It’s really cool to see the project progress in real time like that!
What guidance would you give to other researchers considering creating a citizen research project?
Getting a fresh pair of eyes on your data is really important in project design – sometimes you know the data too well and you’ll be blind to some really simple changes that will make your workflows much more straightforward. Remember to provide positive and negative examples – not just what you should do, but what you shouldn’t do as well. Finally, be ready to respond to your community in the early stages of the project. The first few weeks are really where you build out your FAQs and refine your field guide – especially if your volunteers find unusual examples in your dataset!
Is there anything else you would like to share with our readers?
I wanted to say a huge thank you to our Science Scribbler community! Since our first project launched in 2018, you have contributed over 4.4 million classifications to our projects. That’s the equivalent of 10 years of effort from a full-time employee!