Tag Archives: study

Experiments on the Zooniverse

Occasionally we run studies in collaboration with external  researchers in order to better understand our community and improve our platform. These can involve methods such as A/B splits, where we show a slightly different version of the site to one group of volunteers and measure how it affects their participation, e.g. does it influence how many classifications they make or their likelihood to return to the project for subsequent sessions?

One example of such a study was the messaging experiment we ran on Galaxy Zoo.  We worked with researchers from Ben Gurion University and Microsoft research to test if the specific content and timing of messages presented in the classification interface could help alleviate the issue of volunteers disengaging from the project. You can read more about that experiment and its results in this Galaxy Zoo blog post https://blog.galaxyzoo.org/2018/07/12/galaxy-zoo-messaging-experiment-results/.

As the Zooniverse has different teams based at different institutions in the UK and the USA, the procedures for ethics approval differ depending on who is leading the study. After recent discussions with staff at the University of Oxford ethics board, to check our procedure was up to date, our Oxford-based team will be changing the way in which we gain approval for, and report the completion of these types of studies. All future study designs which feature Oxford staff taking part in the analysis will be submitted to CUREC, something we’ve been doing for the last few years. From now on, once the data gathering stage of the study has been run we will provide all volunteers involved with a debrief message.

The debrief will explain to our volunteers that they have been involved in a study, along with providing information about the exact set-up of the study and what the research goals were. The most significant change is that, before the data analysis is conducted, we will contact all volunteers involved in the study allow a period of time for them to state that they would like to withdraw their consent to the use of their data. We will then remove all data associated with any volunteer who would not like to be involved before the data is analysed and the findings are presented. The debrief will also contain contact details for the researchers in the event of any concerns and complaints. You can see an example of such a debrief in our original post about the Galaxy Zoo messaging experiment here https://blog.galaxyzoo.org/2015/08/10/messaging-test/.

As always, our primary focus is the research being enabled by our volunteer community on our individual projects. We run experiments like these in order to better understand how to create a more efficient and productive platform that benefits both our volunteers and the researchers we support. All clicks that are made by our volunteers are used in the science outcomes from our projects no matter whether they are part of an A/B split experiment or not. We still strive never to waste any volunteer time or effort.

We thank you for all that you do, and for helping us learn how to build a better Zooniverse.

Who Are The Zooniverse Community? We Asked Them…

We are often asked who our community are by project scientists, sociologists, and by the community itself. A recent Oxford study tried to find out, and working with them we conducted a survey of volunteers. The results were interesting and when combined with various statistics that we have at Zooniverse (web logs, analytics, etc) we can start to see a pretty good picture of who volunteers at the Zooniverse.

Much of what follows comes from a survey was conducted last Summer as part of Masters student Victoria Homsy’s thesis, though the results are broadly consistent with other surveys we have performed.  We asked a small subset of the Zooniverse community to answer an online questionnaire. We contacted about 3000 people regarding the survey and around 300 responded. They were not a random sample of users, rather they were people who had logged-in to the Zooniverse at least once in the three months before we emailed them.

The remaining aspects of this post involve data gathered by our own system (classification counts, log-in rates, etc) and data from our use of Google Analytics.

So with that preamble done: let’s see who you are…

https://vimeo.com/99664654

This visualisation is of Talk data from last Summer. It doesn’t cover every project (e.g. Planet Hunters is missing) but it gives you a good flavour for how our community is structured. Each node (circle) is one volunteer, sized proportionally according to how many posts they have made overall. You can see one power-mod who has commented more than 16,000 times on Talk near the centre. Volunteers are connected to others by talking in the same threads (a proxy for having conversations). They have been automatically coloured by network analysis, to reflect sub-networks within the Zooniverse as a whole. The result is that we see the different projects’ Talk sites.

talk-central

There are users that rise largely out of those sub-communities and talk across many sites, but mostly people stick to one group. You can also see how relatively few power users help glue the whole together, and how there are individuals talking to large numbers of others, who in turn may not participate much otherwise – these are likely examples of experienced users answering questions from others.

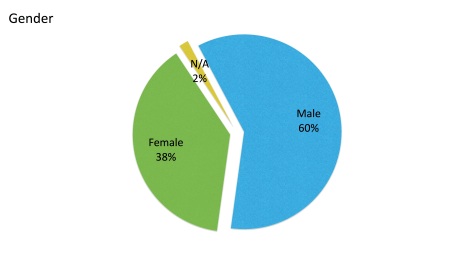
gender One thing we can’t tell from our own metrics is a person’s gender, but we did ask in the survey. The Zooniverse community seems to be in a 60/40 split, which in some ways is not as bad as I would have thought. However, we can do better, and this provides a metric to measure ourselves against in the future.

ages

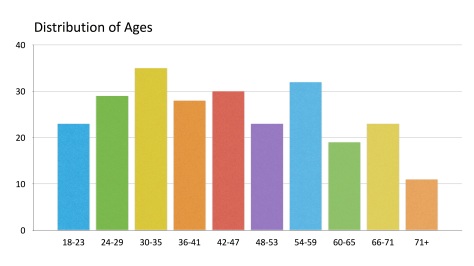
It is also interesting to note that there is very little skew in the ages of our volunteers. There is a slight tilt away from older people, but overall the community appears to be made up of people of all ages. This reflects the experience of chatting to people on Talk.

geo-pie

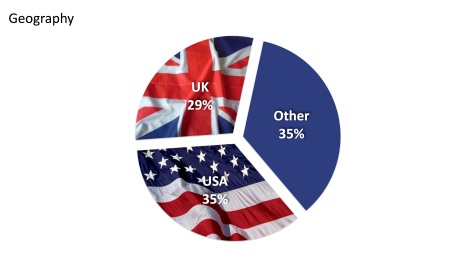
We know that the Zooniverse is English-language dominated, and specifically UK/US dominated. This is always where we have found the best press coverage, and where we have the most links ourselves. The breakdown between US/UK/the rest is basically a three-way split. This split is seen not just in this survey but also generally in our analytics overall.

geo-pie-dev

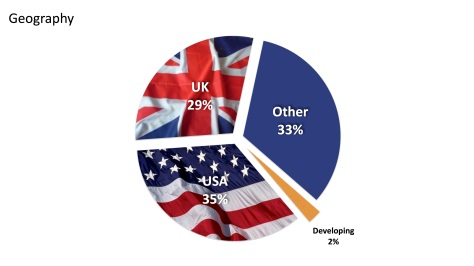
Only 2% of the users responding to our survey only came from the developing world. As you can see in a recent blog post, we do get visitors from all over the world. It may be that the survey has the effect of filtering out these people (it was conducted via an online form), or maybe that there is language barrier.

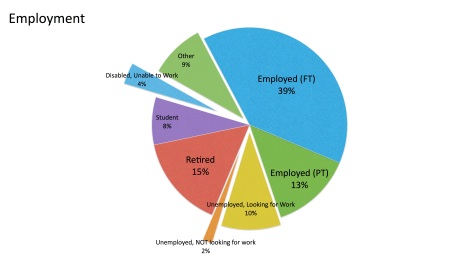
employmentemployment_cloudWe also asked people about their employment status. We find a about half of our community is employed (either full- or part-time). Looking at the age distribution, we might expect up a fifth or sixth of people to be retired (15% is fairly close). This leaves us with about 10% unemployed, nearly twice the UK or US unemployment rate, and about 4% unable to work due to disability (about the UK averaged, by comparison). This is interesting, especially in relation to the next question, on motivation for participating.

We also asked them to tell us what they do and the result is the above word cloud (thanks, Wordle!) which shows a wonderful array of occupations including professor, admin, guard, and dogsbody. You should note a high instance of technical jobs on this list, possibly indicating that people need to have, or be near, a computer to work on Zooniverse projects in their daily life.

motivation

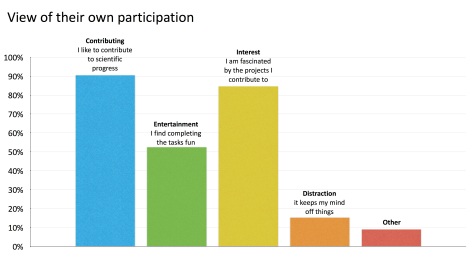
When asked why they take part in Zooniverse projects we find that the most-common response (91%) is a desire to contribute to progress. How very noble. Closely following that (84%) are the many people who are interested in the subject matter. It falls of rapidly then to ‘entertainment’, ‘distraction’ and ‘other’. We are forever telling people that the community is motivated mainly by science and contribution, and for whatever reason they usually don’t believe us. It’s nice to see this result reproducing an important part of the Raddick et. al. 2009 study, which first demonstrated it.

when-to-classfy-routine

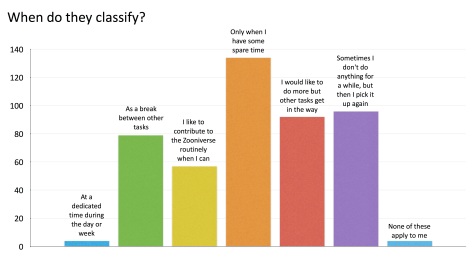
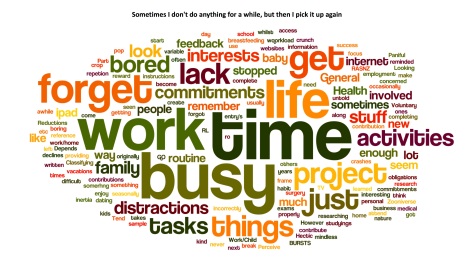
It is roughly what I would have expected to see that people tend to classify mostly in their spare time, and that most don’t have dedicated ‘Zooniverse’ time every day. It’s more interesting to see why, if they tend to stop and start, i.e. if they answered in the purple category above. Here is a word cloud showing the reason people stop participating in Zooniverse. TL;DR they have the rest of their life to get on with.

when-to-classfy-routine-cloud

We’ll obviously have to fix this by making Zooniverse their whole life!

This is my final blog post as a part of the Zooniverse team. It has been by pleasure to work at the Zooniverse for the last five years. Much of that time has been spent trying to motivate and engage the amazing community of volunteers who come to click, chat, and work on all our projects. You’re an incredible bunch, motivated by science and a desire to be part of something important and worthwhile online. I think you’re awesome. In the last five years I have seen the Zooniverse grow into a community of more than one million online volunteers, willing to tackle big questions, and trying and understand the world around us.

Thank you for your enthusiasm and your time. I’ll see you online…