Category Archives: Technical

Zooniverse Workflow Bug

We recently uncovered a couple of bugs in the Zooniverse code which meant that the wrong question text may have been shown to some volunteers on Zooniverse projects while they were classifying. They were caught and a fix was released the same day on 29th November 2018.

The bugs only affected some projects with multiple live workflows from 6th-12th and 20th-29th November.

One of the bugs was difficult to recreate and relied on a complex timing of events, therefore we think it was rare and probably did not affect a significant fraction of classifications, so it hopefully will not have caused major issues with the general consensus on the data. However, it is not possible for us to say exactly which classifications were affected in the timeframe the bug was active.

We have apologised to the relevant science teams for the issues this may cause with their data analysis, but we would also like to extend our apologies to all volunteers who have taken part in these projects during the time the bugs were in effect. It is of the utmost importance to us that no effort is wasted on our projects and when something like this happens it is taken very seriously by the Zooniverse team. Since we discovered these bugs we worked tirelessly to fix them, and we have taken actions to make sure nothing like this will happen in the future.

We hope that you accept our most sincere apologies and continue the amazing work you do on the Zooniverse. If you have any questions please don’t hesitate to contact us at contact@zooniverse.org.

Sincerely,

The Zooniverse Team

Zooniverse Data Aggregation

Hi all, I am Coleman Krawczyk and for the past year I have been working on tools to help Zooniverse research teams work with their data exports.  The current version of the code (v1.3.0) supports data aggregation for nearly all the project builder task types, and support will be added for the remaining task types in the coming months.

What does this code do?

This code provides tools to allow research teams to process and aggregate classifications made on their project, or in other words, this code calculates the consensus answer for a given subject based on the volunteer classifications.  

The code is written in python, but it can be run completely using three command line scripts (no python knowledge needed) and a project’s data exports.

Configuration

The first script is the uses a project’s workflow data export to auto-configure what extractors and reducers (see below) should be run for each task in the workflow.  This produces a series of `yaml` configuration files with reasonable default values selected.

Extraction

Next the extraction script takes the classification data export and flattens it into a series of `csv` files, one for each unique task type, that only contain the data needed for the reduction process.  Although the code tries its best to produce completely “flat” data tables, this is not always possible, so more complex tasks (e.g. drawing tasks) have structured data for some columns.

Reduction

The final script takes the results of the data extraction and combine them into a single consensus result for each subject and each task (e.g. vote counts, clustered shapes, etc…).  For more complex tasks (e.g. drawing tasks) the reducer’s configuration file accepts parameters to help tune the aggregation algorithms to best work with the data at hand.

A full example using these scripts can be found in the documentation.

Future for this code

At the moment this code is provided in its “offline” form, but we testing ways for this aggregation to be run “live” on a Zooniverse project.  When that system is finished a research team will be able to enter their configuration parameters directly in the project builder, a server will run the aggregation code, and the extracted or reduced `csv` files will be made available for download.

Panoptes Client for Python 1.0.3

Hot on the heels of last week’s update, I’ve just released version 1.0.3 of the Python Panoptes Client, which fixes a bug introduced in the previous release. If you encounter a TypeError when you try to create subjects, please update to this new version and that should fix it.

This release also updates the default client ID that is used to identify the client to the Panoptes API. This is to ensure that each of our API clients is using a unique ID.

As before, you can install the update by running pip install -U panoptes-client.

Why you should use Docker in your research

Last month I gave a talk at the Wetton Workshop in Oxford. Unlike the other talks that week, mine wasn’t about astronomy. I was talking about Docker – a useful tool which has become popular among people who run web services. We use it for practically everything here, and it’s pretty clear that researchers would find it useful if only more of them used it. That’s especially true in fields like astronomy, where a lot of people write their own code to process and analyse their data. If after reading this post you think you’d like to give Docker a try and you’d like some help getting started, just get in touch and I’ll be happy to help.

I’m going to give a brief outline of what Docker is and why it’s useful, but first let’s set the scene. You’re trying to run a script in Python that needs a particular version of NumPy. You install that version but it doesn’t seem to work. Or you already have a different version installed for another project and can’t change it. Or the version it needs is really old and isn’t available to download anymore. You spend hours installing different combinations of packages and eventually you get it working, but you’re not sure exactly what fixed it and you couldn’t repeat the same steps in the future if you wanted to exactly reproduce the environment you’re now working in. 

Many projects require an interconnected web of dependencies, so there are a lot of things that can go wrong when you’re trying to get everything set up. There are a few tools that can help with some of these problems. For Python you can use virtual environments or Anaconda. Some languages install dependencies in the project directory to avoid conflicts, which can cause its own problems. None of that helps when the right versions of packages are simply not available any more, though, and none of those options makes it easy to just download and run your code without a lot of tedious setup. Especially if the person downloading it isn’t already familiar with Python, for example.

If people who download your code today can struggle to get it running, how will it be years from now when the version of NumPy you used isn’t around anymore and the current version is incompatible? That’s if there even is a current version after so many years. Maybe people won’t even be using Python then.

Luckily there is now a solution to all of this, and it’s called software containers. Software containers are a way of packaging applications into their own self-contained environment. Everything you need to run the application is bundled up with the application itself, and it is isolated from the rest of the operating system when it runs. You don’t need to install this and that, upgrade some other thing, check the phase of the moon, and hold your breath to get someone’s code running. You just run one command and whether the application was built with Python, Ruby, Java, or some other thing you’ve never heard of, it will run as expected. No setup required!

Docker is the most well-known way of running containers on your computer. There are other options, such as Kubernetes, but I’m only going to talk about Docker here.

Using containers could seriously improve the reproducibility of your research. If you bundle up your code and data in a Docker image, and publish that image alongside your papers, anyone in the world will be able to re-run your code and get the same results with almost no effort. That includes yourself a few years from now, when you don’t remember how your code works and half of its dependencies aren’t available to install any more.

There is a growing movement for researchers to publish not just their results, but also their raw data and the code they used to process it. Containers are the perfect mechanism for publishing both of those together. A search of arXiv shows there have only been 40 mentions of Docker in papers across all fields in the past year. For comparison there have been 474 papers which mention Python, many of which (possibly most, but I haven’t counted) are presenting scripts and modules created by the authors. That’s without even mentioning other programming languages. This is a missed opportunity, given how much easier it would be to run all this code if the authors provided Docker images. (Some of those authors might provide Docker images without mentioning it in the paper, but that number will be small.)

Docker itself is open source, and all the core file formats and designs are standardised by the Open Container Initiative. Besides Docker, other OCI members include tech giants such as Amazon, Facebook, Microsoft, Google, and lots of others. The technology is designed to be future proof and it isn’t going away, and you won’t be locked into any one vendor’s products by using it. If you package your software in a Docker container you can be reasonably certain it will still run years, or decades, from now. You can install Docker for free by downloading the community edition.

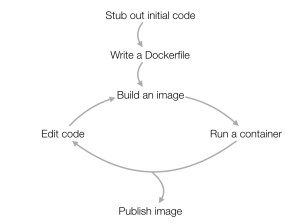
So how might Docker fit into your workday? Your development cycle will probably look something like this: First you’ll probably outline an initial version of the code, and then write a Dockerfile containing the instructions for installing the dependencies and running the code. Then it’s basically the same as what you’d normally do. As you’re working on the code, you’d iterate by building an image and then running that image as a container to test it. (With more advanced usage you can often avoid building a new image every time you run it, by mounting the working directory into the container at runtime.) Once the code is ready you can make it available by publishing the Docker image.

There are three approaches to publishing the image: push the image to the Docker Hub or another Docker registry, publish the Dockerfile along with your code, or export the image as a tar file and upload that somewhere. Obviously these aren’t mutually exclusive. You should do at least the first two, and it’s probably also wise to publish the tar file wherever you’d normally publish your data.


The Docker Hub is a free registry for images, so it’s a good place to upload your images so that other Docker users can find them. It’s also where you’ll find a wide selection of ready-built Docker images, both created by the Docker project themselves and created by other users. We at the Zooniverse publish all of the Docker images we use for our own work on the Docker Hub, and it’s an important part of how we manage our web services infrastructure. There are images for many major programming languages and operating system environments.

There are also a few packages which will allow you to run containers in high performance computing environments. Two popular ones are Singularity and Shifter. These will allow you to develop locally using Docker, and then convert your Docker image to run on your HPC cluster. That means the environment it runs in on the cluster will be identical to your development environment, so you won’t run into any surprises when it’s time to run it. Talk to your institution’s IT/HPC people to find out what options are available to you.

Hopefully I’ve made the case for using Docker (or containers in general) for your research. Check out the Docker getting started guide to find out more, and as I said at the beginning, if you’re thinking of using Docker in your research and you want a hand getting started, feel free to get in touch with me and I’ll be happy to help you. 

Fixed cross-site scripting vulnerability on project home pages

We recently fixed a security vulnerability in the way project titles are handled on project home pages. Prior to this it was possible to create a project which included Javascript in its name, and thus inject code into the page. After investigating this incident, we have determined that this vulnerability has not been exploited for any malicious purpose; no data was leaked and no users were exposed to injected code.

This vulnerability was reported to us on June 20, 2018, by Lacroute Serge. We began testing fixes around three hours later, which were deployed about 15 hours after the original report, on June 21, 2018.

The fixes for this vulnerability are contained in pull requests #4710 and #4711 for the Panoptes Front End project on GitHub. Anyone running their own hosted copy of this should pull these changes as soon as possible.

We have investigated the cause and assessed the impact of this vulnerability. A summary of what we found follows:

  • No data was leaked as a result of this vulnerability. The vulnerability was not exploited for any malicious purpose and there was no unauthorised access to any of our systems.
  • The vulnerability was introduced on September 12, 2017, in a change which was part of our work to allow projects to be translated into multiple languages.
  • We found three projects that contained exploits for this vulnerability (not including projects created by our own team for testing purposes): two were created before the vulnerability was introduced, so the exploit wouldn’t have worked at the time they were created (it might have worked if the projects were visited between September 12, 2017, and June 21, 2018, but no-one did so); the remaining project was created by the security researcher who reported the vulnerability.
  • Our audit included previous titles for projects (all changes to projects are versioned, so we were able to audit any project titles which have since been changed).
  • All three projects contained only benign code to display a JavaScript alert box. None of them attempted to perform any malicious actions.
  • No users other than the project owner and members of our development team visited any of these projects, so no other users activated any of the exploits.

We’d like to thank Lacroute Serge for reporting this vulnerability to us via the method detailed on our security page, following responsible disclosure by reporting it to us in private to give us the opportunity to fix it.

Panoptes CLI 1.0.1 and Panoptes Client for Python 1.0.1

We’ve recently released updates for the Panoptes command-line interface and the Panoptes Client module for Python containing a few bug fixes.

From the changelog for Panoptes Client:

  • Fix: Exports are not automatically decompressed on download
  • Fix: Unable to save a Workflow
  • Fix: Fix typo in documentation for Classification
  • Fix: Fix saving objects initialised from object links

And from the CLI:

  • Fix: Modifying projects makes them private

You can install the updates by running pip install -U panoptescli and pip install -U panoptes-client.

Panoptes CLI 1.0, a command-line interface for managing projects

Following on from the release of Panoptes Client 1.0 for Python, we’ve just released version 1.0 of the Panoptes CLI. This is a command-line client for managing your projects, because some things are just easier in a terminal! The CLI lets you do common project management tasks, such as activating workflows, linking subject sets, downloading data exports, and uploading subjects. Let’s jump in with a few examples.

First, downloading a classification export (obviously you’d insert your own project ID and a filename of your choice):

panoptes project download 764 Downloads/pulsar-hunters-classifications.csv

cli-classification-download.gif

This command will optionally generate a new export and wait for it to be ready before downloading. No more waiting for the notification email!

New subjects can be uploaded to a new subject set like so (again, inserting your own IDs):

panoptes subject-set create 7 "November 2017 subjects"
panoptes subject-set upload-subjects 16401 manifest.csv

cli-subject-upload.gif

You can also pipe the output from the CLI into other standard commands to do more powerful things, such as linking every subject set in your project to a workflow using the xargs command (where 1234 and 5678 are your project ID and workflow ID respectively):

panoptes subject-set ls -q -p 1234 | xargs panoptes workflow add-suject-sets 5678

Visit GitHub to get started with the CLI today!

Introducing Panoptes Client 1.0 for Python

I’m happy to announce that the Panoptes Client package for Python has finally reached version 1.0, after nearly a year and a half of development. With this package, you can automate the management of your projects, including uploading subjects, managing subject sets, and downloading data exports.

There’s still more work to do – I have lots of additional features and improvements planned for version 1.1 – but with the release of version 1.0, the Client has a stable set of core features which are useful for managing projects (both large and small).

I know a lot of people have already been using the 0.x versions while we’ve been working on them, so thanks to everyone who submitted feature requests, bug reports, and pull requests on GitHub. Please do upgrade to the latest version to make sure you have the latest bug fixes, and keep the requests and bug reports coming!

You can find installation and upgrade instructions on GitHub, and full documentation on Read the Docs.

Stargazing Live 2017 Recap

We recently had a very successful (and longer than usual) Stargazing Live. I wanted to talk a little about the work that our team did in the weeks leading up to this and also recap what actually happened behind the scenes during the two weeks of events.

If you’re not familiar with it, Stargazing Live is an annual astronomy TV show on BBC Two in the UK, which is broadcast live on three consecutive nights. Each year we launch a project in collaboration with the show, and this always proves to be the busiest time of our year. This year, for the first time there was a second week of shows for ABC Australia, so this time we launched two projects instead of one: Planet 9 and Exoplanet Explorers.

A lot of work went into making sure that our site stayed up for this year’s shows. In previous years we’ve had issues that have resulted in either a brief outage or reduced performance for at least some of the time during the show. This year everything worked perfectly and we actually found ourselves reducing our capacity (scaling down) much sooner than we anticipated. The prep work fell into three areas:

  • Optimisations to the frontend to reduce the number of API calls made by the site while people were using it. This involved a combination of refactoring, fixing bugs, and modifying the backend to return frequently requested data without it having to be requested separately (e.g. when checking if the user has favourited a subject).
  • Reducing the load on our databases. We reduced the number of requests that result in database queries through caching in the backend (with memcache), and we started using a new microservice (called Designator) to keep track of what each user has seen and serve them new subjects. We also separated some services onto a read replica rather than having them query the primary database.
  • Adding feature flags so that we could turn off anything non-essential, and so that we could shut down any features that were causing problems, using the Flipper Ruby gem.
The Oxford team gathers in the office to watch the show.

On the first night of the BBC show it was all hands on deck. Our teams in the US and the UK were in our offices, despite it being evening in the UK, and in Oxford we gathered around the TV expectantly awaiting the moment when Chris would announce the project’s URL on air. That moment is usually a bit frantic, as several thousand people all turn up on the site at once and start clicking around, registering, logging in, and submitting classifications. We’re always closely watching our monitoring systems, keeping an eye on various performance metrics, watching for any early signs of problems that might affect the performance of the site. This year when that moment came the number of visitors on site shot up to over 5,000, and then… everything just kept running smoothly.

The first night of the BBC show we peaked at about 0.9 million requests per hour, with 1.1 million per hour the second night.

Requests to Zooniverse.org during BBC Stargazing Live 2017.

We scaled our API service to 50 of EC2’s m3.medium instances the first night and the average CPU utilisation of these instances reached about 30% at peak traffic. The next two nights we reduced the number of instances to 40. In hindsight we could have gone even lower, but from past experience the amount of traffic we receive on the second and third nights can be difficult to predict, so we decided to play it safe.

API scaling and CPU utilisation during BBC Stargazing Live 2017.

Traffic during the ABC show was lower than during the BBC show (Australia has a smaller population than the UK, so this was as expected). That week we scaled the API to 40 instances the first night, and 20 instances for the second and third nights.

In the past we’ve had problems with running out of available connections in PostgreSQL. The connection limit depends on available memory, and we find this to be more of a problem than CPU or network constraints. During the shows we scaled the PostgreSQL instance for our main API to RDS’s m4.10xlarge and our Talk/microservices database to m4.2xlarge, primarily to give us enough leeway to avoid the connection limit. In the future we’d like to implement connection pooling to avoid this.

This was all a big improvement on previous years. While before we found ourselves extremely busy fighting fires and fixing bugs between shows, this time we had time to just relax and watch the show. We have more work to do on optimisations, because we did still have to scale up our capacity more than we’d like, but overall we’re very happy with how well things went this year.