Category Archives: News

What’s going on with the classify interface? Part two

Part two in a multi-part series exploring the visual and UX changes to the Zooniverse classify interface

The breakdown

Today and in the next post, we’ll take a look at the reasoning behind specific changes to the classifier that we’ve already started to roll out over the past few months. We’ve had good discussions on Talk about many of the updates, but I wanted to reiterate those conversations here so there’s just one source of information to refer back to in the future.

In case you missed it, the first blog post in this series previews the complete new classify layout.

As a reminder, if you have feedback about these changes or anything else on the site you’d like to see addressed, please use this survey link.

Navigation bar

Updated navigation bar

We started with a rethinking of each project’s navigation bar. The new design features cleaner typography, a more prominent project title, and visual distinction from the sitewide navigation. It also includes the project’s home page background image, giving the project visual distinction while keeping the classify interface itself clean and legible. It’s also responsive: on smaller screen heights, the height of the navigation bar adjusts accordingly.

The most important goal we solved in making this change was to separate the project navigation from the site navigation. During my initial site research and in talking to colleagues and volunteers, many found it difficult to distinguish between the two navigations. Adding a background, a distinct font style, and moving the options to the right side of the page accomplishes this goal.

Neutral backgrounds

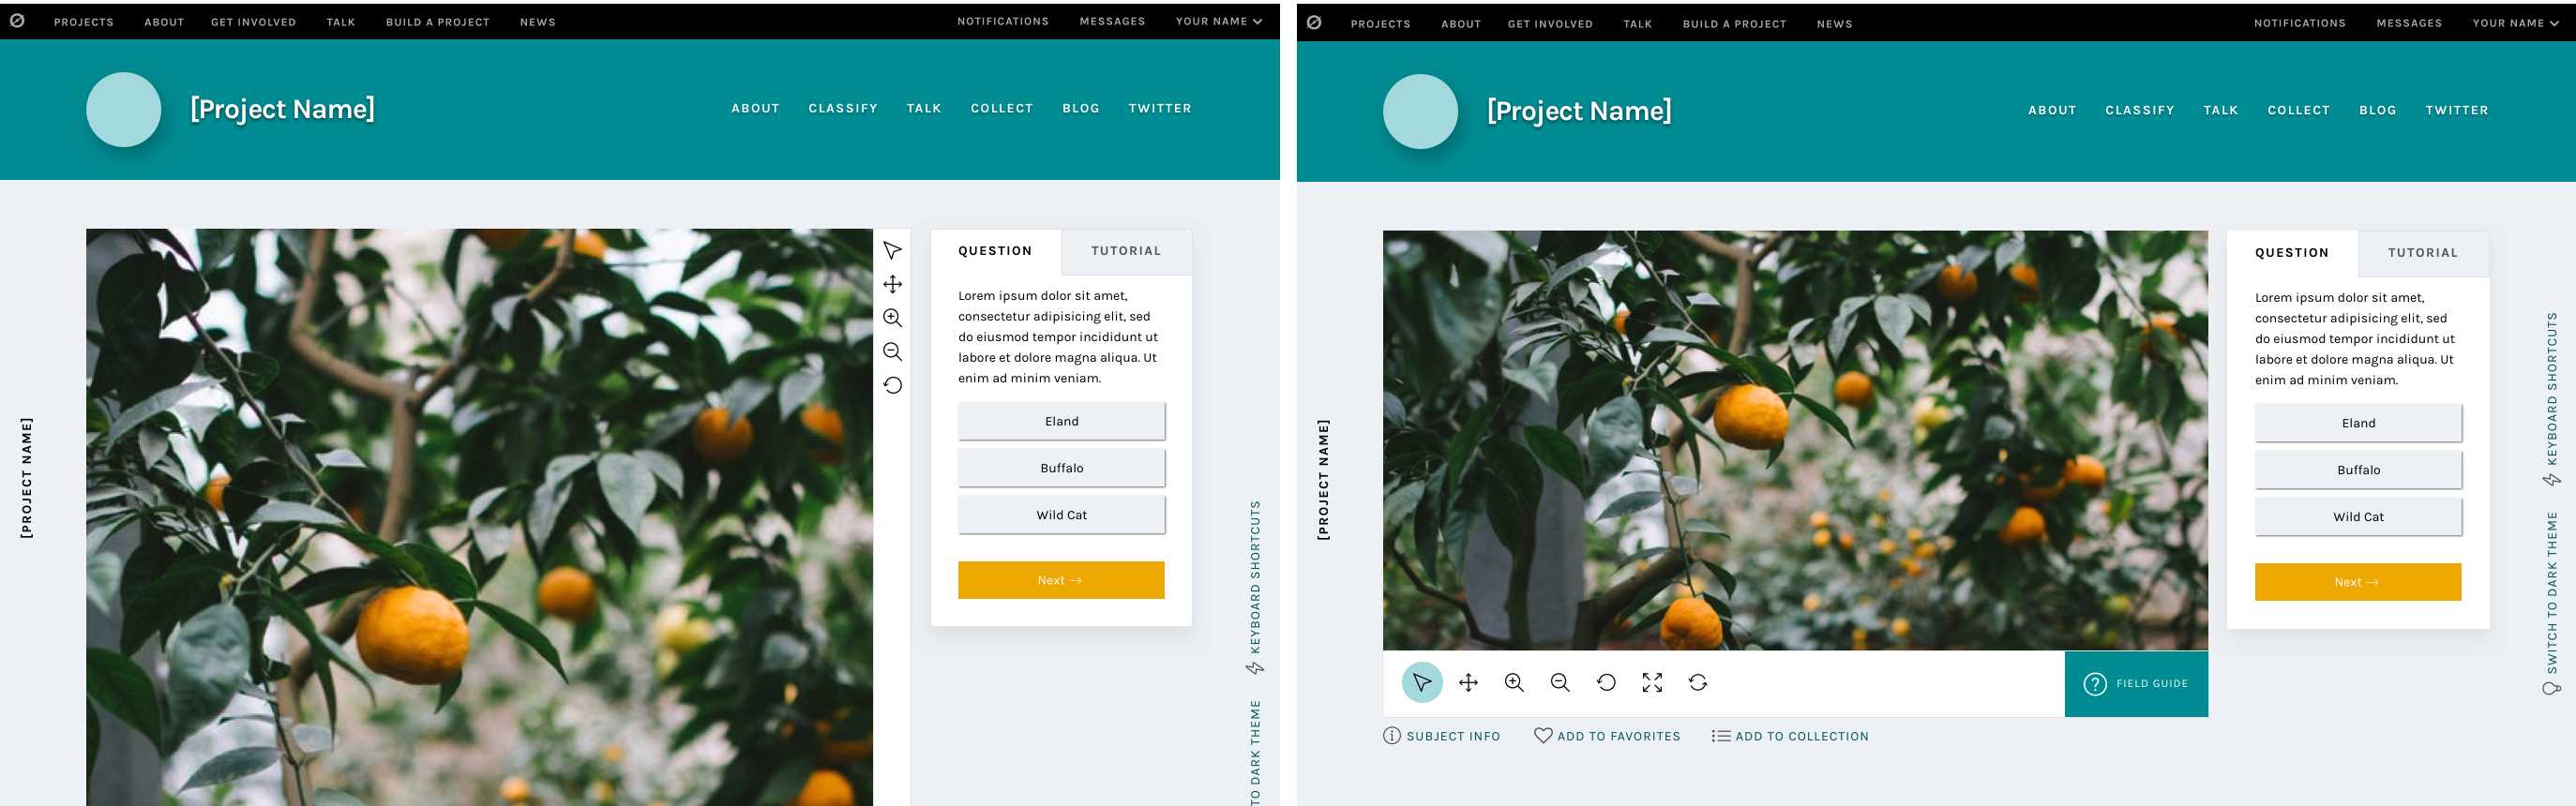
Classify interface with neutral background

In conjunction with adding the background image to the navigation bar, the background image was removed from the main classify interface. It was replaced with a cool light grey, followed quickly by the dark grey of the Dark Theme.

Legibility is one of the main goals of any web designer, and it was the focus of this update. By moving to clean greys, all of the focus is now on the subject and task. There are some really striking subject images on Zooniverse, from images of the surface of Mars to zebras in their natural habitat. We want to make sure these images are front and center rather than getting lost within the background image.

The Dark Theme was a suggestion from a Zooniverse researcher – they pointed out that some subject images are similar in tone to the light grey, so a darker theme was added to make sure contrast would be enough to make the image “pop”. We love suggestions like this! While the team strives to be familiar with every Zooniverse project, the task is sometimes beyond us, so we rely on our researchers and volunteers to point out anomalies like this. If you find something like this, you can use this survey to bring it to my attention.

Another great suggestion from a Zooniverse volunteer was the addition of the project name on the left side of the screen. This hasn’t been implemented yet, but it’s a great way to help with wayfinding if the interface is scrolled to below the navigation bar.

Updated task section

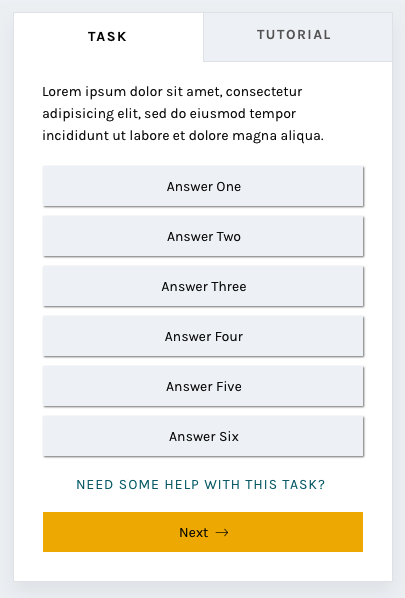
New task section

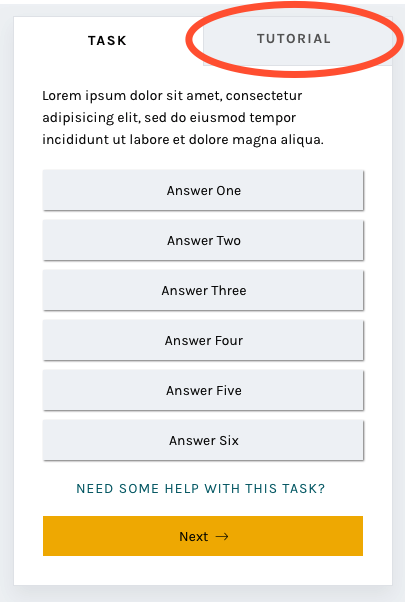
By enclosing the task and its responses in a box rather than leaving it floating in space, the interface gives a volunteer an obvious place to look for the task across every project. Adjusting the typography elevates the interface and helps it feel more professional.

One of the most frequent comments we heard in the 2017 survey was that the interface had far too much scrolling – either the subject image or the task area was too tall. The subject image height will be addressed at a later date, but this new task area was designed specifically with scrolling in mind.

I used the averages I found in my initial project audit and the average screen height (643 px) based on Google Analytics data from the same time period to design a task area that would comfortably fit on screen without scrolling. It’s important to note that there are always outliers in large-scale sites like Zooniverse. While using averages is the best way to design for most projects, we know we can’t provide the most optimal experience for every use case.

You’ll also notice the secondary “Tutorial” tab to the right of the “Task” label. This is a feature that’s yet to be implemented, and I’ll talk more about it in the next post.

And more to come

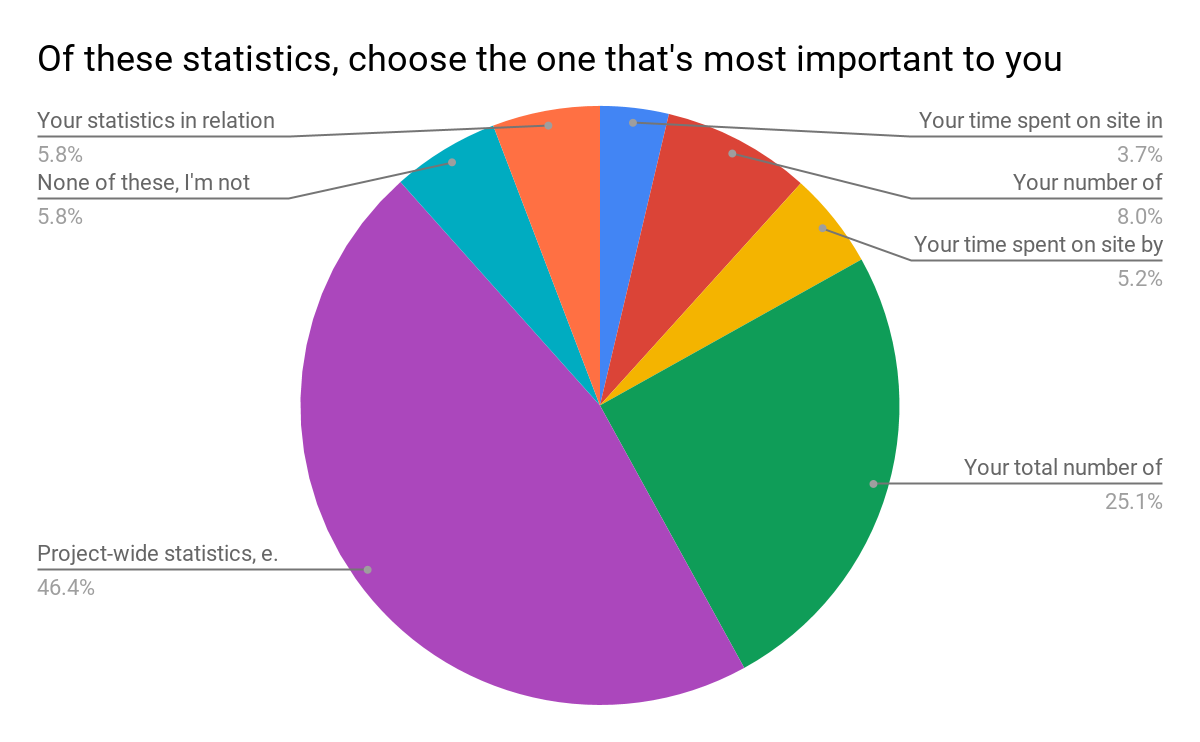
The next installments in this series will address the additional updates we have planned, like updated modals and a whole new stats section.

Check back soon!

What’s going on with the classify interface? Part One

Part one in a multi-part series exploring the visual and UX changes to the Zooniverse classify interface

First, an introduction.

Zooniverse began in 2007, with a galaxy-classifying project called Galaxy Zoo. The project was wildly successful, and one of the lead researchers, Chris Lintott, saw an opportunity to help other researchers accomplish similar goals. He assembled a team of developers and set to work building custom projects just like Galaxy Zoo for researchers around the world.

And things were good.

But the team started to wonder: How can we improve the process to empower researchers to build their own Zooniverse projects, rather than relying on the team’s limited resources to build their projects for them?

Thus, the project builder (zooniverse.org/lab) was born.

In the first year of its inception, the number of projects available to citizen scientist volunteers nearly doubled. Popularity spread, the team grew, and things seemed to be going well.

That’s where I come in. * Record scratch *

Three years after the project builder’s debut, I was hired as the Zooniverse designer. With eight years’ experience in a variety of design roles from newspaper page design to user experience for mobile apps to web design, I approached the new project builder-built projects with fresh eyes, taking a hard look at what was working and what areas could be improved.

Over the next week, I’ll be breaking down my findings and observations, and talking through the design changes we’re making, shedding more light on the aims and intentions behind these changes and how they will affect your experience on the Zooniverse platform.

If you take one thing away from this series it’s that this design update, in following with the ethos of Zooniverse, is an iterative, collaborative process. These posts represent where we are now, in June 2018, but the final product, after testing and hearing your input, may be different. We’re learning as we go, and your input is hugely beneficial as we move forward.

Here’s a link to an open survey in case you’d like to share thoughts, experiences, or opinions at any point.

Let’s dive in.

Part one: Research

My first few weeks on the job were spent exploring Zooniverse, learning about the amazing world of citizen science, and examining projects with similar task types from across the internet.

I did a large-scale analysis of the site in general, going through every page in each section and identifying areas with inconsistent visual styles or confusing user experiences.

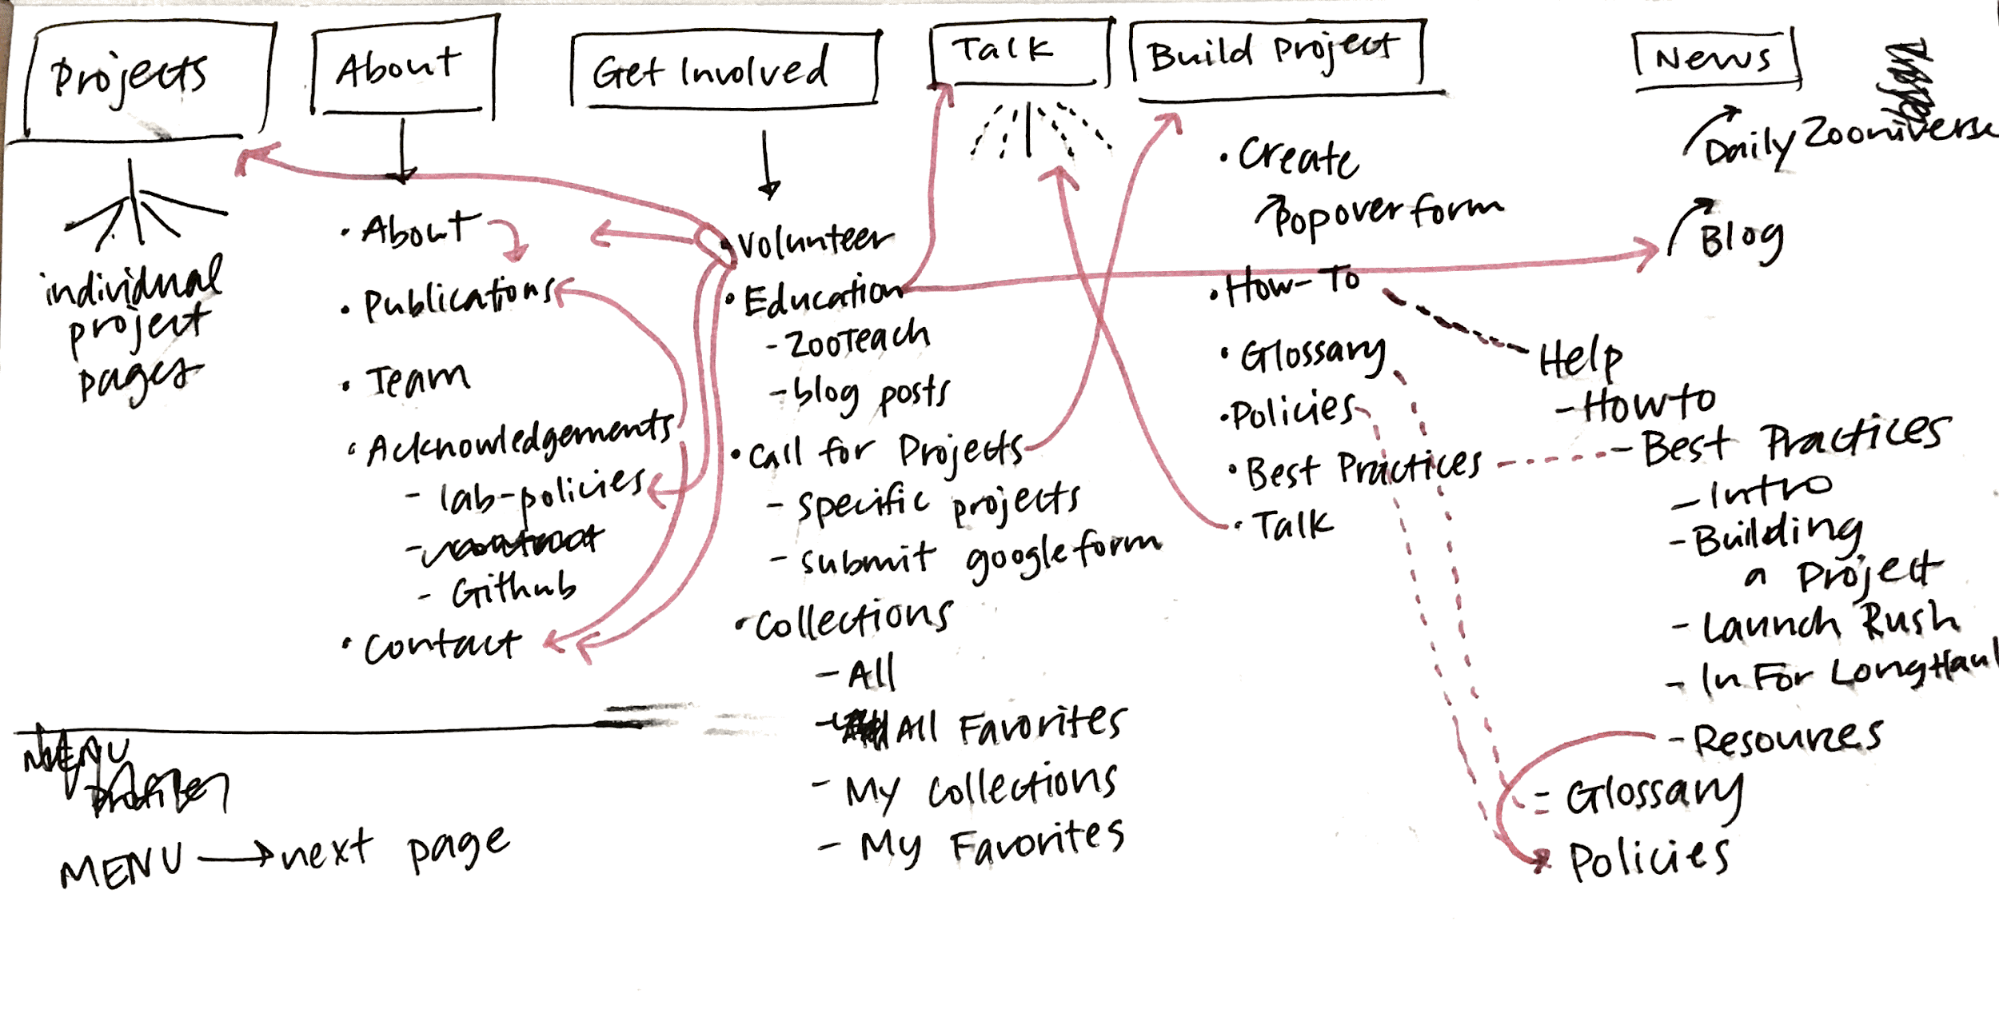
Current site map, March 2017
Analysis of current template types

After my initial site analysis, I created a list of potential pages or sections that were good candidates for a redesign. The classify interface stood out as the best place to start, so I got to work.

Visual design research

First, I identified areas of the interface that could use visual updates. My main concerns were legibility, accessibility, and varying screen sizes. With an audience reaching to the tens of thousands per week, the demographic diversity makes for an interesting design challenge.

Next, I conducted a comprehensive audit of every project that existed on the Zooniverse in March 2017 (79 in total, including custom projects like Galaxy Zoo), counting question/task word count, the max number of answers, subject image dimensions, field guide content, and a host of other data points. That way, I could accurately design for the medians rather than choosing arbitrarily. When working on this scale, it’s important to use data like these to ensure that the largest possible group is well designed for.

Here are some selected data:

Task type: Drawing 20
Answers
Average number of possible answers 2 Answer average max word count 4.5
Min number 1 Answer max max word count 10
Max number 7 Answer min max word count 2
Median number 1 Answer median max word count 1
Number with thumbnail images 1


Task type: Question 9
Answers
Average number of possible answers 6 Answer average max word count 6
Min number 2 Answer max max word count 18
Max number 9 Answer min max word count 1
Median number 3.5 Answer median max word count 4
Number with thumbnail images 3


Task type: Survey 9
Answers
Average number of possible answers 31 Answer average max word count 4
Min number 6 Answer max max word count 7
Max number 60 Answer min max word count 3
Median number 29 Answer median max word count 4
Number with thumbnail images 9

Even More Research

Next, I focused on usability. To ensure that I understood issues from as many perspectives as possible, I sent a design survey to our beta testers mailing list, comprising about 100,000 volunteers (if you’re not already on the list, you can opt in via your Zooniverse email settings). Almost 1,200 people responded, and those responses informed the decisions I made and helped prioritize areas of improvement.

Here are the major findings from that survey:

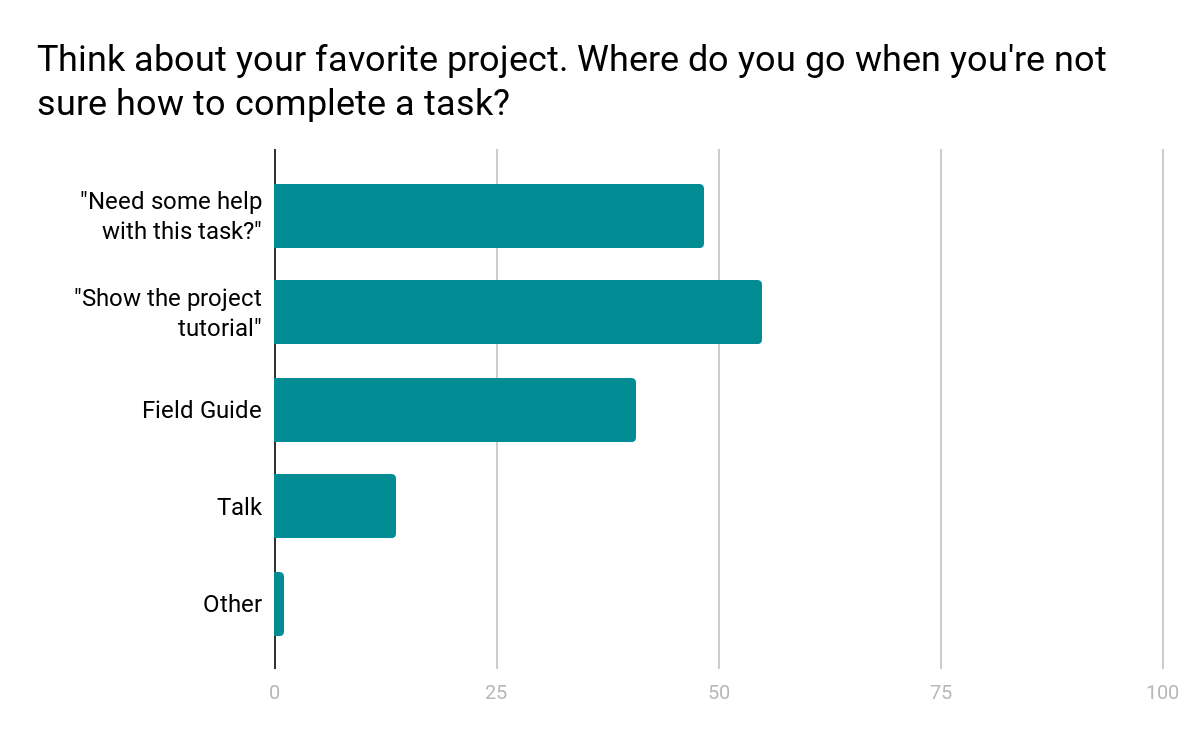
  • No consensus on where to go when you’re not sure how to complete a task.
  • Many different destinations after finishing a task.
  • Too much scrolling and mouse movement.
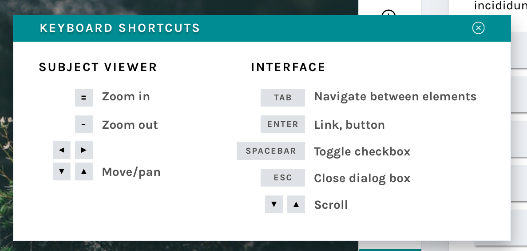
  • Lack of keyboard shortcuts.
  • Would like the ability to view previous classifications.
  • Translations to more languages.
  • Need for feedback when doing classifications.
  • Finding new projects that might also be interesting.
  • Larger images.

In the next few blog posts, I’ll be breaking down specific features of the update and showing how these survey findings help inform the creation of many of the new features.

Without further ado

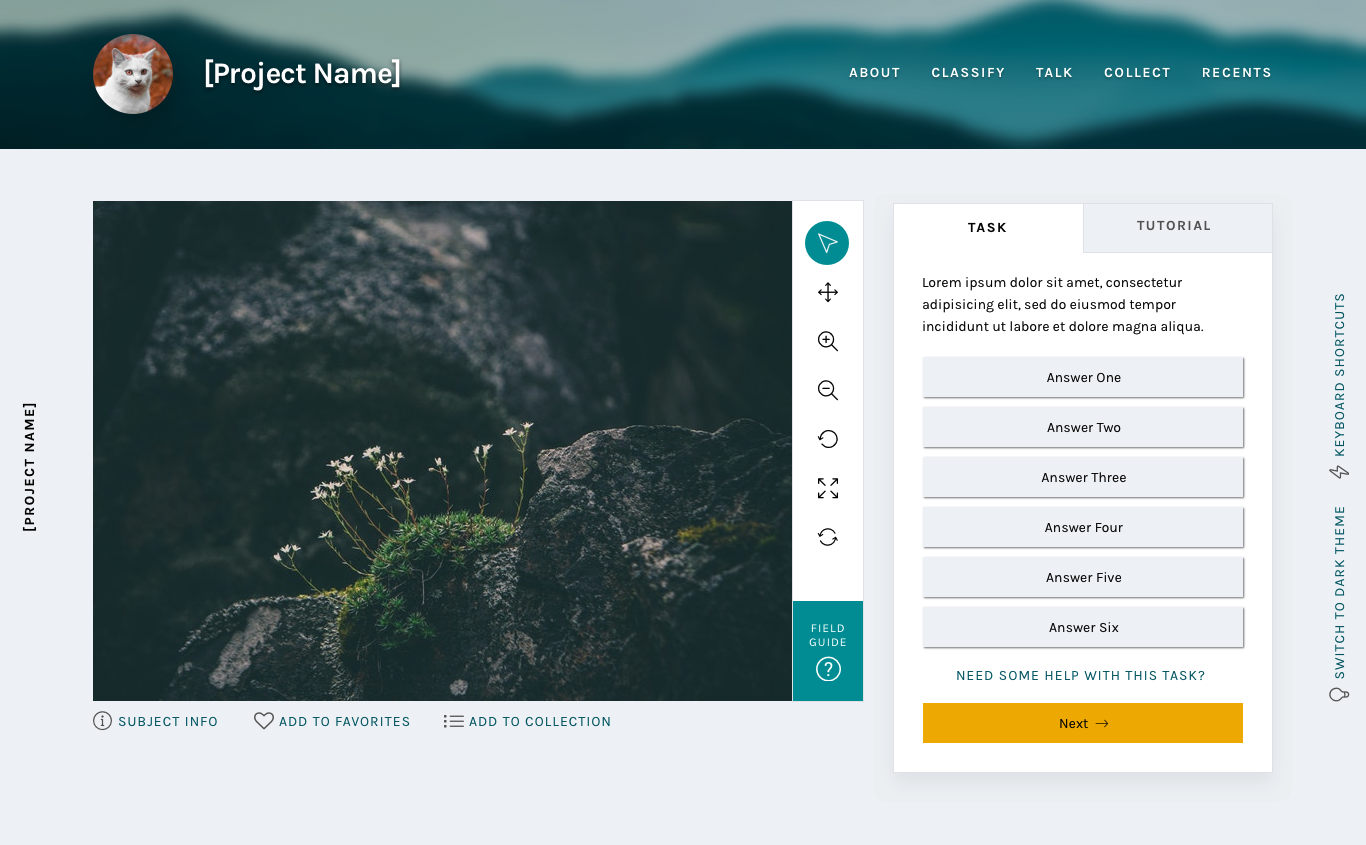
Basic classify template

Some of these updates will look familiar, as we’ve already started to implement style and layout adjustments. I’ll go into more detail in subsequent posts, but at a high level, these changes seek to improve your overall experience classifying on the site no matter where you are, what browser you’re using, or what type of project you’re working on.  

Visually, the site is cleaner and more professional, a reflection of Zooniverse’s standing in the citizen science community and of the real scientific research that’s being done. Studies have shown that good, thoughtful design influences a visitor’s perceptions of a website or product, sometimes obviously, sometimes at a subliminal level. By making thoughtful choices in the design of our site, we can seek to positively affect audience perceptions about Zooniverse, giving volunteers and researchers even more of a reason to feel proud of the projects they’re passionate about.

It’s important to note that this image is a reflection of our current thought, in June 2018, but as we continue to test and get feedback on the updates, the final design may change. One benefit to rolling updates out in pieces is the ability to quickly iterate ideas until the best solution is found.

The timeline

We estimate that the updates will be mostly in place by early 2019.

This is due in part to the size of our team. At most, there are about three people working on these updates while also maintaining our commitments to other grant-funded projects and additional internal projects. The simple truth is that we just don’t have the resources to be able to devote anyone full-time to this update.

The timeline is also influenced in a large part by the other half of this update: A complete overhaul of the infrastructure of the classifier. These changes aren’t as visible, but you’ll notice an improvement in speed and functionality that is just as important as the “facelift” portion of the update.

Stay tuned!

We’ve seen your feedback on Talk, via email, and on Github, and we’re happy to keep a dialog going about subsequent updates. To streamline everything and make sure your comments don’t get missed, please only use this survey link to post thoughts moving forward.

Who’s who in the Zoo – Yassine Benhajali

In this week’s edition of our Who’s who in the Zoo series, meet Yassine Benhajali, who runs Brain Match.

– Helen


yassine - Yassine Benhajali

Project: Brain Match

Researcher: Yassine Benhajali

Location: Anthropology Department, Université de Montréal, Canada.


What are your main research interests?

How nature and nurture interact to influence brain functioning.


Who else is in your project team? What are their roles?

Sebastian Urchs, Aman Badhwar and Pierre Bellec (Project Supervisor).


Tell us more about the data used in your project

Brain Match uses images of brain that have been made freely available thanks to the efforts of The Neuro Bureau (http://www.neurobureau.org/) and the ADHD-200 consortium (http://fcon_1000.projects.nitrc.org/indi/adhd200/index.html).


How do Zooniverse volunteers contribute to your research? 

In general, manual quality control of brain images is very subjective and time consuming task. Zooniverse volunteers are helping us in two key ways; firstly, they are helping to validate our brain image quality control procedure, and secondly, to produce enough rated images to train computers to perform the quality control automatically.


What have been the biggest challenges in setting up your project?

Our biggest challenge was to build simple and comprehensive instructions.


What discoveries, and other outputs, has your project led to so far?

To date, with the help of Zooniverse, we have developed the first quality control procedure on brain imaging that could be performed by both novice or expert neuroscience raters. They both agree on most of the ratings. We are hoping to present this work at a conference soon (http://www.neuroinformatics2018.org/abstracts/).


Once you’ve finished collecting data, what research questions do you hope to be able to answer?

The next step will be to train machine learning model based on the information from Zooniverse raters, and to test if this model can perform as well as human rater.


What’s in store for your project in the future?

More data to rate, and other brain imaging modalities.


What are your favourite other citizen research projects and why?

I like all wildlife protection projects.


What guidance would you give to other researchers considering creating a citizen research project?

Make your tutorial clear and concise.


And finally, when not at work, where are we most likely to find you?

Biking, running and swimming.


Notes on Mobile: Launching a Workflow

Hello! It’s probably about time that I introduce myself. I am the (relatively) new mobile developer working on the Zooniverse Android and iOS apps. I joined the team back in February and, as the sole developer on the project, I want to not only improve and enhance our current app, but also focus on making sure our community of project builders and volunteers are excited and engaged with the app.

So, what is the app?

As our user base on the app is significantly smaller than our user base on the website, I am guessing that a fair share of the people reading haven’t even used the app. Both the Android and iOS apps are very specialized version of the website.

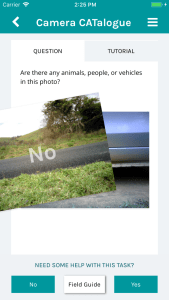
More specifically, the app only supports a specific type of workflow: A question workflow with only two answers. Here’s a screen cap from one of the current running projects: CameraCatalogue.

Simulator Screen Shot - iPhone 6 - 2018-05-16 at 14.25.56

As the image shows, the user can swipe left or right based on the answers given below. But don’t take it from me. Give it a try!

How do I get my project on mobile?

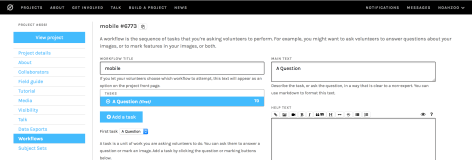
Deploying a project to mobile is not so hard. In fact, it’s just a matter of adding a mobile enabled workflow to your project. As mentioned before, the mobile app only shows question workflows, so you are going to want to configure a workflow with just a question task:

mobile builder

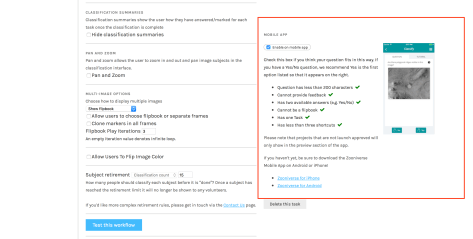
Now that you have a question task set up, you may notice the ‘Mobile App’ section at the bottom of the page:

mobileapp.png

As long as all of the criteria in the checklist are met you can enable your project for mobile. And that’s it! If your project is launch approved it will show up in the app. 

Can I test the workflow before it goes live?

Yes! On the most recent release of the app we introduced a preview mode. Here’s how it works.

Prerequisites:

  • Project visibility set to public
  • Project state set to development
  • Project has a workflow that is mobile enabled

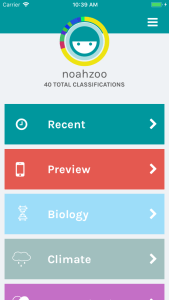
You can view this project if you log in to the app with an account that is either an owner or collaborator on the project. If everything was set up correctly, you should see a preview tab in the main menu like so:

Simulator Screen Shot - iPhone 6 - 2018-05-17 at 10.39.32

From there you should be able to view and run your workflow just as it would appear when it is actually live.

Beta for mobile is coming

As of now, only projects that are currently launch approved can add mobile workflows. This is because we have no beta process set up for the app.

But stay tuned! We are working on a beta system for mobile. I’ll be making another blog post once that is live.

Who’s who in the Zoo – Ellie Mackay

In this week’s edition of Who’s who in the Zoo, meet Mission Director of The Plastic Tide, Ellie Mackay.

– Helen 


07061701 Ellie 117 - Ellie Worldwide.jpg


Project: The Plastic Tide

Researcher: Ellie Mackay, Mission Director & Drone Pilot

Location: London, UK


What are your main research interests?

Plastic pollution, aerial imagery and image object recognition.


Who else is in your project team? What are their roles?

Peter Kohler, Co-Founder.


Tell us more about the data used in your project

The photographs come from aerial surveys of over 40 beaches in the UK and worldwide.


How do Zooniverse volunteers contribute to your research? 

They help us to train the algorithm to detect plastics automatically – this is a huge task which requires lots of photo tagging, so the volunteers help immensely with getting through all these images.


What have been the biggest challenges in setting up your project?

Financial backing/funding! We’ve had to self-fund to get the project off the ground and we’re now looking for sponsors to take the project to Phase 2.


What discoveries, and other outputs, has your project led to so far?

Extensive media coverage on multiple national and regional media channels as well as social media. Informed a secondary project on the psychological wellbeing of beach cleaning vs online volunteering.


Once you’ve finished collecting data, what research questions do you hope to be able to answer?

Where is the missing 99% of ocean plastic? Which beaches are most polluted and why? Which types of plastics wash up on different types of beaches? What are the most common types of plastic marine litter? How does plastic marine litter vary seasonally/after storms/over time/following innovations?


What’s in store for your project in the future?

Securing funding for:

  • Increasing the accuracy of the autonomous detection
  • Gathering more imagery from global contributors. -Accumulating further tagging by volunteers through Zooniverse
  • Creating greater public awareness through documentary, video and audio promotion
  • Generating engagement in citizen science through educational programmes and public engagement programmes
  • Creating an open source global map of plastic pollution.


What are your favourite other citizen research projects and why?

Everything on Zooniverse!


What guidance would you give to other researchers considering creating a citizen research project?

Definitely use Zooniverse if you can – it makes life a lot easier and gives you access to a whole network of dedicated and brilliant volunteers.


And finally, when not at work, where are we most likely to find you?

Travelling, diving, filming or photographing the great outdoors, Speaking at Adventure Uncovered, RGS or similar events, or at schools across the UK Promoting plastic-free living through my website and social media.


Celebrating Earth Day

Zooniverse team members based at Chicago’s Adler Planetarium celebrated Earth Day this weekend at Earthfest, a two-day-long celebration of the planet we call home.

Visitors to the Adler Planetarium participate in a Zooniverse hands-on activity during Earthfest

In addition to many activities for all ages throughout the museum, museum visitors were able to speak with Zooniverse team members to learn about the many earth-related projects available online and on the app. Visitors could also participate in a real-life version of Floating Forests, in which they used tracing paper to illustrate areas of kelp forests on a satellite image. The activity demonstrated how Zooniverse researchers use aggregation to combine many classifications into one very accurate result. Stay tuned for the results of those tracings, coming soon!

Check out a few more photos from the event here.

Zooniverse team members also had some help from our friends at the Field Museum, who stopped by to talk about Microplants, a Zooniverse project studying some of the earliest land plants in the liverwort genus Frullania.

We love speaking with museum visitors and sharing the excitement of participating in real citizen science projects. If you’re in the Chicago area and missed us last weekend, keep an eye out for more information about the Adler Planetarium’s spring Members’ Night, when we’ll have even more fun Zooniverse-related activities for you!

WHO’S WHO IN THE ZOO – MEG SCHWAMB

In this week’s edition of Who’s who in the Zoo Meg Schwamb tells us more about the Planet Four: Terrains project.

– Helen


IMG_9047_1 - Meg Schwamb

Project: Planet Four: Terrains

Researcher: Meg Schwamb, Assistant Scientist

Location: Gemini Observatory, Hilo, Hawaii


What are your main research interests?

I study how planets and their building blocks form and evolve, applying ground-based surveys to probe our Solar System’s small body reservoirs and citizen science to mine large datasets for Solar System science.


Who else is in your project team? What are their roles?

Candy Hansen (PSI) is the PI of the project, K-Michael Aye (LASP) & Anya Portyankina (LASP) are also members of the science team.


Tell us more about the data used in your project

The images reviewed on Planet Four: Terrains come from the Context Camera (CTX) aboard Mars Reconnaissance Orbiter (MRO). The Context Camera takes black and white wide view images (~30 km x ~60 km with ~6 m/pixel resolution) of the Martian surface that we cut into smaller chunks reviewed on the site.


How do Zooniverse volunteers contribute to your research? 

We ask volunteers to review the CTX subimages of the South Polar region of Mars and identify whether they see specific features: (1) araneiforms (including features with a central pit and radiating channels known as ‘spiders’) carved by carbon dioxide jets; (2) erosional depressions, troughs, mesas, ridges, and quasi-circular pits characteristic of the South Polar Residual Cap (SPRC) which we collectively refer to as ‘Swiss cheese terrain’, and (3) craters.


What have been the biggest challenges in setting up your project?

Figuring out the format and contents of the classification exports.


What discoveries, and other outputs, has your project led to so far?

Our first paper was accepted last year to a journal. Planet Four: Terrains has identified new regions of carbon dioxide jet activity including areas with jet carved channels (spiders/araneiforms) on geologic units previously thought to be resistant to the process (locations the spiders/araneiforms weren’t expected to be). More details here (http://blog.planetfour.org/2017/08/29/planet-four-terrains-first-science-paper-accepted-for-publication/).


Once you’ve finished collecting data, what research questions do you hope to be able to answer?

What is the distribution of aranaeiforms (spiders) over the South Polar regions? Why do we find araneiforms (spiders) in specific locations outside of the South Polar Layered Deposits?


What’s in store for your project in the future?

Expanding to a larger search area and exploring areas further from the South Pole of Mars to see how far North spiders may exist.


What are your favourite other citizen research projects and why?

I’m currently involved in several Zooniverse projects, so I think they are all my favorites: Planet Four, Planet Four: Ridges, and Comet Hunters.


What guidance would you give to other researchers considering creating a citizen research project?

Be cognizant that combining the multiple volunteer classifications together is likely very different from what you’ve done in the past for data analysis. Also, treat your project volunteers’ as your collaborators.


And finally, when not at work, where are we most likely to find you?

Baking and watching soccer (hoping the Chicago Fire make the playoffs).


For more information, check out the Planet Four Blog Post.


Who’s who in the Zoo – Martin Jones

In the third of our Who’s who in the Zoo series, meet Etch A Cell‘s Dr Martin Jones

– Helen


HarryMugshot - Martin Jones.png

Project: Etch A Cell

Researcher: Martin Jones, Deputy Head of Microscopy Prototyping

Location: Electron Microscopy Science Technology Platform, The Francis Crick Institute, London, UK


What are your main research interests?

Imaging and image analysis.


Who else is in your project team? What are their roles?

Lucy Collinson (head of EM STP) leads the EM team, Chris Peddie (Principal Laboratory Research Scientist) acquired the data, Anne Weston (Senior Laboratory Research Scientist) performed the expert analysis.


Tell us more about the data used in your project

The images are from our “serial block face scanning electron microscope” and are of small groups of HeLa cells (a type of cancer cell). The electron microscope allows us to see objects down to a few billionths of a metre in size. Each cell is divided up into around 200-300 individual sections (like a loaf of sliced bread) so we can see the insides of the cell. To start with we hope to analyse around 50 cells, but as a core facility we have an endless supply of different types of data we’d like to analyse!


How do Zooniverse volunteers contribute to your research? 

The Zooniverse volunteers help us with our “segmentation” task – tracing a line over the nuclear envelope, which is a very important membrane inside the cell that separates the nucleus from the rest of the cell.


What have been the biggest challenges in setting up your project?

One of the key advantages of the citizen science approach is that we can have several different volunteers analyse each image, allowing us to combine the results to get a statistical understanding of the data. Combining the volunteers’ work in the most effective way possible turns out to be pretty tricky though! Especially since our data is stored as lots of individual lines, meaning a simple average doesn’t really work.


What discoveries, and other outputs, has your project led to so far?

The first thing we wanted to make sure was that the data we get is good enough, which thankfully it looks like it is! Even that was perhaps a bit unexpected to some people! We’ve found it has been popular as an education and outreach tool too, with reports of teachers using it in their classes to teach about cells. We’ve also shown it off at an event at the Natural History Museum in London and a CRUK event in Manchester and spoken about it at several conferences around the world. We’re writing up the first journal article about it right now in fact!


Once you’ve finished collecting data, what research questions do you hope to be able to answer?

While electron microscopy produces amazingly detailed images, there are very few studies where data has been fully quantified at large scale, since it’s such a labour-intensive process at the moment. By measuring the shapes of each object (nucleus, mitochondria etc.) in different types of cell we can perform robust quantitative comparisons that are not currently possible. This sort of knowledge will help us to understand many different diseases, like cancer, malaria and tuberculosis, as well as help us find effective treatments for those diseases.


What’s in store for your project in the future?

There’s a lot more to come from Etch a cell! We have plenty more data that we’d like to analyse in the same way – tracing outlines – but for some other objects inside a cell we think a different approach might be easier and more effective. We’re working on a few options, and hopefully future iterations will be easier for people to work with on mobile devices. In parallel, we’re also building an artificial intelligence system to use the results from Etch a cell to enable us to train computers to be as good at the task as humans.


What are your favourite other citizen research projects and why?

Bash The Bug was released at the same time as Etch a cell and is a really great project. EyeWire is another electron microscopy project that has been groundbreaking in the field of “connectomics” – trying to understand how the cells in brains are connected together. Cancer Research UK has produced several different projects with a great deal of success, it was our initial interaction with their team that brought citizen science to our attention in the first place.


What guidance would you give to other researchers considering creating a citizen research project?

Have a play around with the project builder, setting up a basic project is really easy!


And finally, when not at work, where are we most likely to find you?

I try to get outdoors as much as possible, whether that’s walking, running or cycling.


Penguins, Plastics, and Poo

This week’s guest blog post is from Dr Gemma Hall, who is leading a range of Zooniverse educational outreach initiatives in the UK. Read on to find out about the activities she led earlier this month during British Science Week.

– Helen


Penguins, Plastics, and Poo

Science Week, a week when we scientists gush about our favourite subject, attempt to explain to others what we do all day or just get plain messy with icky, sticky crowd-pleasing experiments. I think I successfully covered all these things during Science Week. And I have Zooniverse to thank for (most of) this.

I’m a STEM Ambassador (https://www.stem.org.uk), which means I do lots of science outreach. And I’m a huge Zooniverse fan. Whether it’s bashing bugs, elephant expeditioning or galaxy-gazing, I love that anyone with a computer/internet connection can help with real people-powered research, including children.

So, for Science Week, instead of just talking about what scientists do, I used Zooniverse to get primary school children being the scientists. Children like feeling important, so key to engaging them from the outset meant emphasising the importance of helping real researchers make the world a better place. Cue dramatic gasps and disbelieving looks all around the ICT Suite!

Children also like being able to relate to what they’re learning about. And so, I introduced them to the researchers they would be helping…


Penguins

 Scene: Children transfixed by a PowerPoint presentation showing a picture of Dr Tom Hart, of Penguin Watch, wrapped up against the harsh Antarctic elements, surrounded by penguins.

Tom is a Penguinologist, and I almost had to stop the teachers stampeding out of the ICT Suite in an effort to re-train so they too can get such a great job title. The children, meanwhile, were more captivated by the wondrous site of the hundreds of penguins.

I told the class that Tom’s laboratory is the Antarctic and he wears hefty, cold weather gear rather than a white lab coat. He studies penguins because they give us a really good indication of the effects humans have on the Antarctic. Tom needs to keep an eye on the penguins across many Antarctic sites, all day, every day of the year. However, I continued, Tom can’t live in the Antarctic all year because it’s too harsh and he’d miss his family. He has cameras taking hundreds of photos every day and now has so many that he needs help to analyse them.

And with that, the children keenly set about tagging penguins: Adelies, King, Gentoos, Chinstraps; adults, chicks and eggs. They were careful to observe the behaviour of the penguins and their habitats, which both gave indications of whether the penguins might be incubating eggs or caring for chicks. They imagined what working in the harsh Antarctic environment would be like and they were intrigued about what penguins get up to in the night!

The energy in the classroom could have powered the computers the children were using! And the concentration levels and tagging skills were higher than I’ve seen many adults apply (sorry, Adults!). Furthermore, they asked if they could continue helping to spot penguins at home, so huge was their passion to help.

If you want spot penguins too, go to: penguinwatch.org


Plastics

Scene: Children looking at a PowerPoint presentation picture of a beach, with Peter Kohler and Ellie McKay of The Plastic Tide flying their drone.

Plastics have been in the news lots recently and these children were very clued-up, so they needed little introduction to the plastic problem. Already sufficiently motivated to help clean up our planet, they were spurred on even more by hearing that the The Plastic Tide project is the official project of British Science Week and that it was featuring on Sky News and the BBC!

I explained that Peter and Ellie needed help to tag plastic or litter in beach pictures taken by drones. Tagging the pictures teaches a computer program to recognise plastic. The more pictures that are tagged, the better the program will become. Soon, computers will be able to find the plastics themselves, aiding the creation of a global inventory of marine plastic pollution.

The children set to the task with determination, but it soon became apparent that they were not all totally happy; some were frustrated that not all the images had plastics in. After a gentle reminder that we really shouldn’t be hoping to find plastics and that it’s better to have plastic-free beaches, they returned to the task, only to exclaim later that tagging plastics was making them angry. However, this time, they were annoyed that they had spotted so much plastic and litter. Among their finds we had shoes, old toys, many bottle tops, rope, plastic bags, scores of fragments and even an old, gnarled “danger” sign.

We calculated that in one class of 30 children, each child had tagged between 10 and 20 images, so all together they had helped tag an outstanding 300–600 images. With many other schools around the country also tagging plastics, no wonder the Science Week target to tag over 250 000 images was smashed within days. In fact, by the final day, The Plastic Tide had a record-breaking 1.5 million tags—6 times their original target! That equates to 290 000 a day or 800+ tags a minute!

I spoke to Peter at the end of Science Week and he was blown away by the energy and support:

“Science Week has been a huge boost to tagging. The more tags we get, the better the computer algorithm becomes at detecting plastic. Each tag could help find millions more of the same item and will help us clean up our beaches”.

Peter also confided that there are some very exciting announcements coming soon from The Plastic Tide, so keep an eye out for those, and KEEP TAGGING!


Poo

I bet you’re wondering where the “poo” in the title comes from? Well, that’s the icky sticky crowd-pleaser I was referring to at the start. Let’s just say that soggy Weetabix squeezed through nylon tights with a hole in the toe end is a really great way to demonstrate the intestine and how it results in… poo! And I’m also told that before you see a penguin colony in the Antarctic, you smell it first.

For a cleaner approach to science, use Zooniverse!


Get tagging!

Get your children tagging!

Help with REAL research and make the world a better place.


gemma-pic.jpg

Dr Gemma Hall is a Science & Technology Writer and STEM Ambassador. She loves explaining complex things simply, and enthusing people about the importance of science to their everyday lives. Gemma is working to develop Zooniverse in schools, enabling young people to perform real research so that they better understand what scientists do.


Email: gemmaSTEM@gmail.com

Twitter: @Gemma_STEM

Who’s who in the Zoo – Anabelle Cardoso

In the second of our series of ‘meet the researcher’ blog posts, meet PhD student Anabelle Cardoso, who leads the very popular elephant-spotting project, Elephant Expedition. 

– Helen


OLYMPUS DIGITAL CAMERA

Anabelle (fourth from left) and the on-the-ground research team at the research station in Gabon


Project: Elephant Expedition

Researcher: Anabelle Cardoso, PhD Candidate

Location: School of Geography and the Environment, University of Oxford, UK


What are your main research interests?

‘Elephant Expedition’ is part of my PhD research at the University of Oxford, which I started in 2015. Our research is about understanding how forest elephants affect the ecosystems they live in.

Forest elephants are extremely endangered, largely due to hunting for ivory. However, because they live in such mysterious and remote forests, we don’t know as much about them as we would like to. Learning more about these important and threatened animals is critical, as the better you understand an animals ecology the more effectively you can advocate for and plan its conservation.

In our study site in Gabon, and across Africa, valuable savanna habitat is being lost due to over-expanding forests as a result of human-induced global change. Normally, you wouldn’t think of growing forests as a threat, but savanna habitat is home to most of the remaining large mammals in Africa and performs many important ecosystem functions, including carbon storage, so loss of savannas is a global concern. Elephants are ecosystem engineers meaning that they have a disproportionately large impact on the ecosystems they live in. This gives then the unique potential to affect how much forest or savanna is in a landscape, so they can help protect savannas in the face of expanding forests. Most of the research on how elephants might do this has been done on bush elephants, which are a completely different species to the forest elephants of central Africa. Our research aims to remedy this by focusing on how forest elephants affect the forest and savanna balance of the landscape they live in.

In order to better understand forest elephants, we first need to know where they are, so we’ve set up a network of hidden camera traps to photograph them as they move through the forest. Our 40 camera traps are attached to trees and take a photo when triggered by motion or heat. They are super useful for monitoring dangerous and elusive animals like forest elephants because they function 24/7 and can give us a really good idea about where in the landscape the elephants are spending their time without us having to disturb the elephants by following them on foot. This is where the citizen scientists come in – because the camera traps are quite sensitive they don’t only capture images of elephants, but also gorillas, chimpanzees, buffalo, antelope, or even passing birds and bats. The citizen scientists help us to classify all the images into categories based on what’s in them. We can then convert these classifications into data about where the elephants are at what times of year, and link it with our other environmental measurements to draw conclusions. What the citizen scientists contribute is absolutely essential to the research, and forms the backbone of everything we do.


Who else is in your project team? What are their roles?

Yadvinder Malhi (Oxford), Imma Oliveras (Oxford), William Bond (University of Cape Town), and Kate Abenermethy (University of Stirling) supervise me; and Josue Edzang-Ndong (ANPN Gabon) and David Lehmann (ANPN Gabon, University of Stirling) and Kathryn Jeffery (ANPN Gabon, University of Stirling) help managed the project on the ground in Gabon. A special mention should be made to @melvinosky and @jwidness, our wonderful project moderators.


Tell us more about the data used in your project

We have 40 motion and heat sensitive cameras set up along rainforest edges in Gabon, they take photos of all passing animals (mostly elephants, but also a lot of gorillas, chimpanzees, buffalo, leopard, and red river hogs!). These are the images that the volunteers help to classify.


How do Zooniverse volunteers contribute to your research? 

In our project, volunteers are shown an image from one of our camera traps and they have to classify it according to what animal is in it. If the image contains a forest elephant, they also have to count how many elephants they see. The project is simple, so volunteers of all ages and skill levels can join, plus they can classify hundreds of images and therefore get lots of opportunities to spot cool animals.

The project’s feasibility relies on citizen scientists – from our network of hidden camera traps in the rainforest of Gabon we have nearly 2 million photographs we need to analyse and this would be impossible without the help of our dedicated volunteers. To date, there are 10,000 citizen scientists signed up on our website from all parts of the world, as long as you have an internet connection you can join the team.

Citizen science is wonderful because everybody benefits. As researchers we can process very large data sets (like our set of elephant photos) by harnessing the power of thousands of minds all working towards a common goal. This enables us to expand our research scope far beyond what would be possible as individuals – it’s the ultimate global collaboration. The citizen scientists benefit too. Volunteers are exposed to experiences that they might not otherwise have access to, for example in Elephant Expedition you essentially go on a virtual safari through the central African rainforest looking for forest elephants, gorillas, chimpanzees, leopards or mandrills (a type of monkey) – this just isn’t something most people will ever get the chance to do in real life. The project also has a vibrant online community of volunteers. One of the volunteers is a cancer sufferer and she says that participating in our project allows her to not be excluded from doing something just because she’s sick, it gives her a way to pass the time in hospital and makes her feel part of something meaningful.

Since we have so many camera traps and they are highly sensitive, we have many photographs – nearly 2 million! The photographs have a time and location stamp, so each time a volunteer classifies an image as having an elephant in it we know when and where that elephant was sighted. This information from the volunteers is synthesised and is what we’re using to build a time series of elephant habitat use across the landscape. Without the volunteers we would have no way of analysing the images, and therefore no data with which to answer our research questions. Citizen scientists play an integral role in the success of the project, the bottom line is that without them the project wouldn’t be able to work.


What have been the biggest challenges in setting up your project?

It isn’t really a challenge, more a learning journey. I think the amount of time it takes was a challenge, that you always have to be connected to answer questions and see to issues, and of course just learning how to manage such massive data sets has been a steep learning curve! It’s been great though, and I’ve been really humbled by the experience, because all of the volunteers on the project are so lovely and helpful it’s been amazing to be a part of.


What discoveries, and other outputs, has your project led to so far?

We haven’t started doing data analysis yet but we are very excited to see the results! We will be keeping all the volunteers updated on the project page as things continue.


What’s in store for your project in the future?

We have one more small run of final photos, and then we will begin the data analysis and writing up some research! It’s all very exciting and should be coming together in the next few months.


What are your favourite other citizen research projects and why?

Oh! I loved Snapshot Serengetti!


What guidance would you give to other researchers considering creating a citizen research project?

The potential for citizen science research is truly astounding. The world is a big place and the internet is able to connect us with one another. There are millions of potential volunteers across the globe who care as much about what you are researching as you do, and citizen science is an amazing way to connect with them. The best way to make a project effective is to find clever ways of linking volunteers and researchers according to the research interests of both. I think project effectiveness can also be measured by what both researchers and volunteers gain, for example did the research fulfil its scientific aims? Was the scope of the research enhanced by being able to use a global network of volunteers? Did the volunteers feel they gained some enjoyment and knowledge from the process of engaging with it? Would volunteers educate those around them about the research?

When designing a citizen science project, we found it most important to always remember that the people who volunteer to help you are smart and they care about what you’re researching. By including them in the project they become a part of the project, so always appropriately respect their time and skills. Our project depends on people sacrificing time out of their lives to help reach a research goal, so we always make sure we put in the time to communicate with volunteers, answer questions, and just generally engage personally with the people who make the project possible.


And finally, when not at work, where are we most likely to find you?

In Oxford, writing my thesis or destressing with some yoga, or maybe at home in Cape Town, South Africa, walking on the mountain or swimming in the sea. I also love to take road-trips across Southern Africa, there’s always something beautiful to see!


To learn more about Elephant Expedition, check out Annabelle’s Twitter account (@ellieexpedition) or Instagram Page (@elephantexpedition), or click here to go directly to the project.