Insights for Informal Science Institutions from Citizen Science Projects

Today we have a guest post from Dr. Ryan Cook, Citizen Science Learning Researcher at the Adler Planetarium.  Ryan earned his PhD in socio-cultural anthropology from the University of Chicago.  His research interests include ethnographic  investigations in Mexico and the US on the intersection of science and religion.

It has been my pleasure to be a researcher for Zooniverse, based at the Adler Planetarium in Chicago, since May 2012. This position has exercised my anthropologist’s curiosity about how people understand and engage with science, taking it in an interesting and very productive new direction that I plan to continue. Thus I am pleased to have a chance to share my work on this blog.

At this writing I am close to completing my portion of a federally-funded project studying Zooniverse volunteers.  I have benefitted greatly in this research from the assistance of your esteemed edu-bloggers, Kelly and Laura, as well as my former Adler colleague Jason Reed and former supervisor Karen Carney. Specifically, we tried to determine whether and how much volunteers’ conceptions of and attitudes towards science changed through their participation in virtual citizen science projects.

This week, I presented some of our findings at the Visitor Studies Association’s annual conference in the town that beer built: Milwaukee, Wisconsin. Outfitted with a snazzy poster and a pile of official Zooniverse postcards and stickers, I argued for the relevance of our studies of Zoo volunteers to museums and science centers that want visitors to their websites to learn about science.

To know what could possibly be learned about science in Zooniverse, Karen, Kelly, and I put together a model of understanding science to guide us. We based the model’s criteria on what scholars who theorize, research, and teach science claimed as central characteristics of the sciences — for instance, relying on sense experience, proceeding methodically or logically, and revising knowledge in light of new evidence.

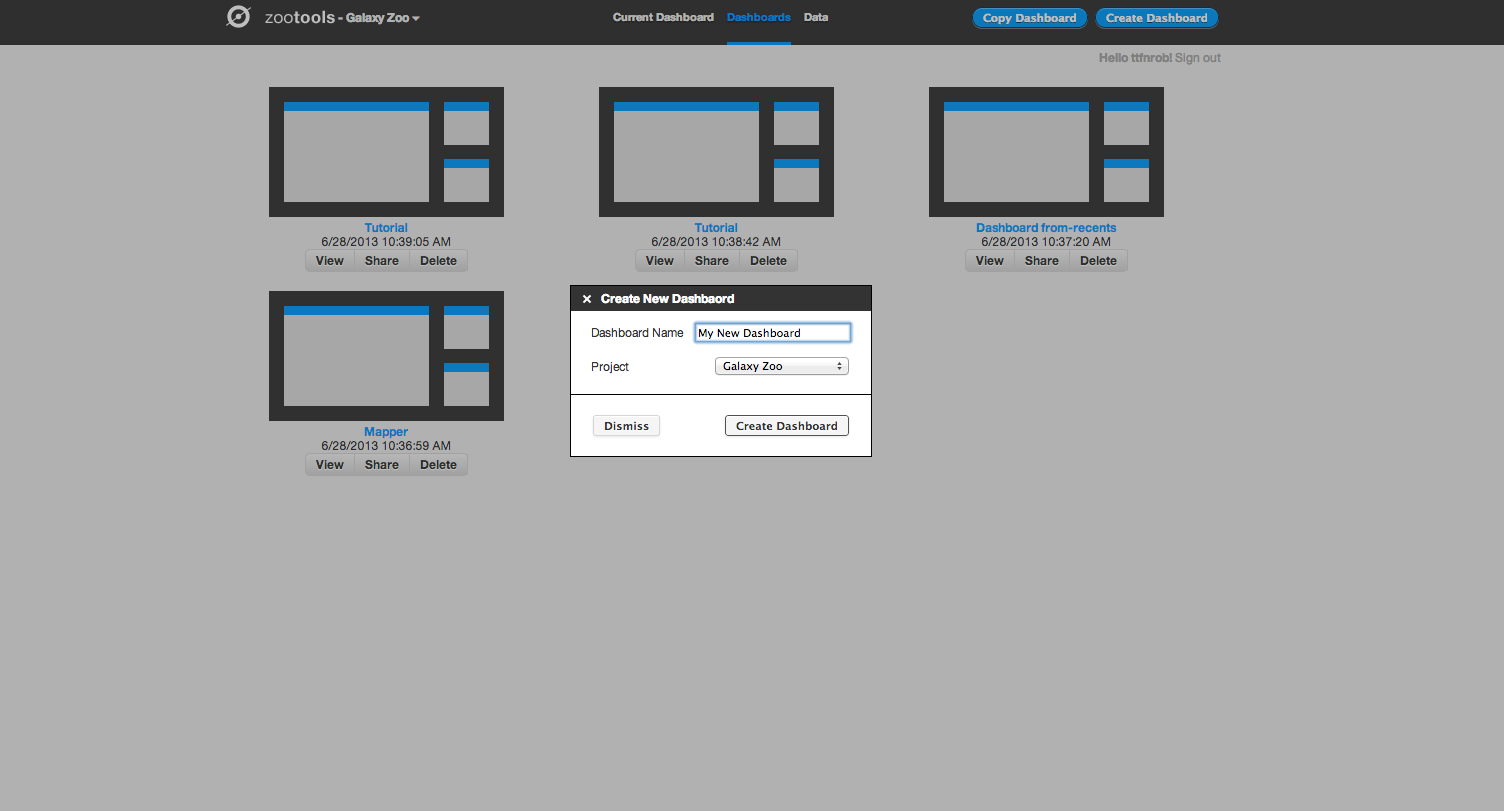
I then spent several months combing through Zooniverse databases and Google Analytics tables, trying to create a quantitative picture of how volunteers engaged with the tasks, blogs, and forums making up each Zoo. Figure 1 shows an example of the data by which we quantified and compared engagement among Zoos.

Fig. 1 - Old Weather visitor flow, Google Analytics
Fig. 1 – Old Weather visitor flow, Google Analytics

Following the lead of some preliminary statistics, Kelly and I applied our model to mapping out opportunities for learning about science in a subset of mature Zoos (i.e., those launched before the shift to an all-in-one-page design strategy). The Zoos were chosen in pairs with similar tasks but different levels of volunteer engagement:

[*Since the Supernovae Zoo was retired during the course of our project, it was included in the engagement variables but left out of subsequent research stages.]

Upon matching these engagement statistics to the range and type of learning opportunities we identified, three main patterns emerged:

  1. Opportunities for science learning were unevenly distributed within and across Zoos’ webpages. Talk and the Forums, for instance, allow a wide range of volunteers to engage in rich communication with each other and with moderators, administrators, and the science teams regarding the scientific import of the Zoos.
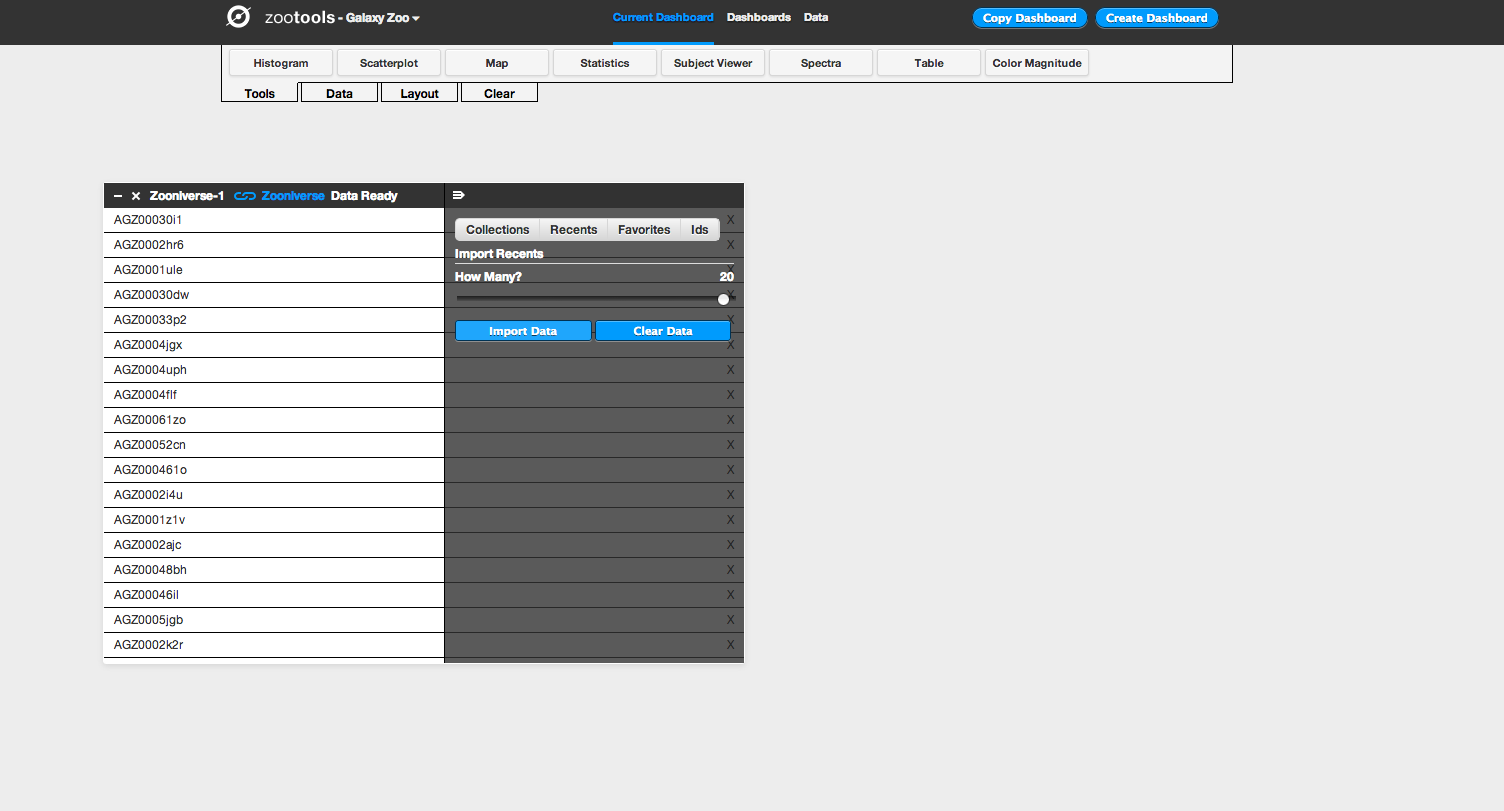
  2. The parts of the Zoos where volunteers went in the greatest numbers and spent the most time were typically those with the fewest, most limited, and least obvious learning opportunities. High-traffic, low-opportunity pages included the classification, marking, and transcription tasks at the core of each Zoo, as we can see in Figure 2.
Fig. 2 - average time on page by page type
Fig. 2 – average time on page by page type

1. Of the more than 700,000 volunteers to visit these Zoos at the time of our analysis, only a small percentage stayed long enough or reached enough pages to encounter many of the learning opportunities we identified.

Each of these findings makes sense if we bear in mind that Zooniverse did not start out as a platform for volunteers to learn about science, but rather as a tool for scientists to carry out certain kinds of data-intensive research.

I contended in my VSA presentation that this mismatch offered museums and science centers some guidance in how to (re)design their websites to improve the chances that visitors would encounter opportunities to learn what the institutions decided was important. Laura, Kelly, and the Zooniverse team have been testing out ways to design more learning opportunities into the “stickiest” parts of the Zoos.

And as for me, I have followed up this quantitative work with a series of in-depth interviews of heavily involved volunteers. By coding their responses based on an extended version of our science learning model, I aim to find out what they feel they learned from their Zooniverse engagement and how it helps us to determine how one segment of volunteers engaged with the science learning opportunities we identified. This interview material will appear along with the engagement data and the science learning model in my report, which should be completed by late September. Stay tuned: you will hear about it first!

Chasing Storms Online with the New Cyclone Center

Cyclone Center has recorded almost 250,000 classifications from volunteers around the world since its launch in September 2012. We’ve had lots of feedback on the project and have recently made significant changes that we think will make the experience of classifying storms more rewarding.

Patterns in storm imagery are best recognized by the human eye, so the scientists behind Cyclone Center are asking you to help look through 30 years of images of tropical storms. The end product will be a new global tropical cyclone dataset that could not be realistically obtained in any other fashion. We have already found that the pattern matching by our classifiers is doing better in many cases than a computer algorithm on the same images – this is very exciting!

The biggest change to the site is that we’re now targeting storms for classification. We’ve shifted to a system where the whole community will work on particular storms until they’re finished. This produces useful data very quickly – and means we can classify timely and scientifically useful storms as needed. These targeted storms will change frequently as you help us complete each one. You can check a box on the Cyclone Center home page that will mean you get alerted when new targeted storms appear: we hope to recruit a horde of enthusiastic online storm chasers this way.

Cyclone Centre Homepage

We’ve added much more inline classification guidance – gone are the days of clicking on question marks to get help.  For each step in the process, you will be shown information on how to best answer the question. We think this will give you more confidence in what you are doing and hopefully inspire you to do even more!

We’ve improved the tutorial and we’re providing more feedback as you go along – now instead of waiting for several images to see the “Storm Stats” page, you will immediately go there after your first image. We’ve also upgraded Cyclone Center Talk, which allows for better searching and highlights more of the interesting discussions going on between other citizen scientists.

All-in-all it’s a big change for an awesome project. Log in to Cyclone Center today and give the new version a try. Don’t forget to check the box to start getting alerted to new storms as they appear: this will be incredibly useful for the research behind the site, and means you can be the first to classify data on new storms.

[Visit http://www.cyclonecenter.org and see the blog at http://blog.cyclonecenter.org]

Zoo Tools: A New Way to Analyze, View and Share Data

Since the very first days of Galaxy Zoo, our projects have seen amazing contributions from volunteers who have gone beyond the main classification tasks. Many of these examples have led to scientific publications, including Hanny’s Voorwerp, the ‘green pea’ galaxies, and the circumbinary planet PH1b.

One common thread that runs through the many positive experiences we’ve had with the volunteers is the way in which they’ve interacted more deeply with the data. In Galaxy Zoo, much of this has been enabled by linking to the Sloan SkyServer website, where you can find huge amounts of additional information about galaxies on the site (redshift, spectra, magnitudes, etc). We’ve put in similar links on other projects now, linking to the Kepler database on Planet Hunters, or data on the location and water conditions in Seafloor Explorer.

The second part of this that we think is really important, however, is providing ways in which users can actually use and manipulate this data. Some users have been already been very resourceful in developing their own analysis tools for Zooniverse projects, or have done lots of offline work pulling data into Excel, IDL, Python, and lots of other programs (see examples here and here). We want to make using the data easier and available to more of our community, which has led to the development of Zoo Tools (http://tools.zooniverse.org). Zoo Tools is still undergoing some development, but we’d like to start by describing what it can do and what sort of data is available.

An Example

Zoo Tools works in an environment which we call the Dashboard – each Dashboard can be thought of as a separate project that you’re working on. You can create new Dashboards yourself, or work collaboratively with other people on the same Dashboard by sharing the URL.

Zoo Tools Main Page

Create a New Dashboard

Within the Dashboard, there are two main functions: selecting/importing data, and then using tools to analyze the data.

The first step for working with the Dashboard is to select the data you’d like to analyze. At the top left of the screen, there’s a tab named “Data”. If you click on this, you’ll see the different databases that Zoo Tools can query. For Galaxy Zoo, for example, it can query the Zooniverse database itself (galaxies that are currently being classified by the project), or you can also analyze other galaxies from the SDSS via their Sky Server website.

Import Data from Zooniverse

Clicking on the “Zooniverse” button, for example, you can select galaxies in one of four ways: a Collection (either your own or someone else’s), looking at your recently classified galaxies, galaxies that you’ve favorited, or specific galaxies via their Zooniverse IDs. Selecting any of these will import them as a dataset, which you can start to look at and analyze. In this example we’ll import 20 recent galaxies.

Import 20 Recents

After importing your dataset, you can use any of the tools in Dashboard (which you can select under “Tools” at the top of the page) on your data. After selecting a tool, you choose the dataset that you’d like to work with from a dropdown menu, and then you can begin using it. For example: if I want to look at the locations of my galaxies on the sky, I can select the “Map” tool. I then select the data source I’d like to plot (in this case, “Zooniverse–1”) and the tool plots the coordinates of each galaxy on a map of the sky. I can select different wavelength options for the background (visible light, infrared, radio, etc), and could potentially use this to analyze whether my galaxies are likely to have more stars nearby based on their position with respect to the Milky Way.

The other really useful part is that the tools can talk to each other, and can pass data back and forth. For example: you could import a collection of galaxies and look at their colour in a scatterplot. You could then select only certain galaxies in that tool, and then plot the positions of those galaxies on the map. This is what we do in the screenshots below:

This slideshow requires JavaScript.

Making Data Analysis Social

You can also share Dashboards with other people. From the Zoo Tools home page you can access your existing dashboards as well as delete them and share them with others. You can share on Twitter and Facebook or just grab the URL directly. For example, the Dashboard above can be found here – with a few more tools added as a demonstration.

Sharing a Dashboard

This means that once you have a Dashboard set up and ready to use, you can send it to somebody else to use too. Doing this will mean that they see the same tools in the same configuration, but on their own account. They can then either replicate or verify your work – or branch off and use what you were doing as a springboard for something new.

What ‘Tools’ Are There?

Currently, there are eight tools available for both regular Galaxy Zoo and the Galaxy Zoo Quench projects:

  • Histogram: makes bar charts of a single data parameter
  • Scatterplot: plot any two data parameters against each other
  • Map: plot the position of objects on the sky, overplotted on maps of the sky at different wavelengths (radio, visible, X-ray, etc.)
  • Statistics: compute some of the most common statistics on your data (eg, mean, minimum, maximum, etc).
  • Subject viewer: examine individual objects, including both the image and all the metadata associated with that object
  • Spectra: for galaxies in the SDSS with a spectrum, download and examine the spectrum.
  • Table: List the metadata for all objects in a dataset. You can also use this tool to create new columns from the data that exists – for example, take the difference between magnitudes to define the color of a galaxy.
  • Color-magnitude: look at how the color and magnitude of galaxies compare to the total population of Galaxy Zoo. A really nice way of visualizing and analyzing how unusual a particular galaxy might be.

We have one tool up and running for Space Warps called Space Warp Viewer. This lets users adjust the color and scale parameters of image to examine potential gravitational lenses in more detail.

Snapshot Serengeti Dashboard

Finally, Snapshot Serengeti has several of the same tools that Galaxy Zoo does, including Statistics, Subject Viewer, Table, and Histogram (aka Bar Graph). There’s also Image Gallery, where you can examine the still images from your datasets, and we’re working on an Image Player. There’s a few very cool and advanced tools we started developing last week – they’re not yet deployed, but we’re really excited to let you follow the activity over many seasons or by focusing on particular cameras. Stay tuned. You can see an example Serengeti Dashboard, showing the distribution of Cheetahs, here (it’s also shown in the screenshot above).

We hope that Zoo Tools will be an important part of all Zooniverse projects in the future, and we’re looking forward to you trying them out. More to come soon!

Galaxy Zoo Quench: A New Kind of Citizen Science

A new ‘mini’ project went live yesterday called Galaxy Zoo Quench. This project involves new images of 6,004 galaxies drawn from the original Galaxy Zoo. As usual, everyone is invited to come and classify these galaxies, but this project has a twist that makes it special! We hope to take citizen science to the next level by providing the opportunity to take part in the entire scientific process – everything from classifying galaxies to analyzing results to collaborating with astronomers to writing a scientific article!

Galaxy Zoo Quench

Galaxy Zoo Quench is examining a sample of galaxies that have recently and abruptly quenched their star formation. These galaxies are aptly named Post-Quenched Galaxies. They provide an ideal laboratory for studying galaxy evolution. So that’s exactly what we want to do: with the help of the Zooniverse community. We hope you’ll join us as we try out a new kind of citizen science project. Visit http://quench.galaxyzoo.org to learn more.

The entire process of classifying, analyzing, discussing, and writing the article will take place over an ~8-12 week period. After classifying the galaxies, Quench volunteers can use tools.zooniverse.org to plot the data and look for trends. We also have a special Quench Talk forum to discuss and identify key results to include in the paper – above you can see examples of some of the cool objects people have already found and discussed.

Have questions about the project? Leave a comment here or ask us on Twitter (@galaxyzoo) or on the Galaxy Zoo Facebook page. In case you’re worried: the regular Galaxy Zoo will continue as normal.

Now go visit http://quench.galaxyzoo.org and start classifying!

Zooniverse Live Chat

A small team of scientists and developers from across the Zooniverse are gathered at Adler Planetarium in Chicago this week to pitch and work on ideas for advanced tools for some of your favorite Zooniverse projects. Our goal is to come up with some  tools and experiences that will help the Zooniverse volunteers further explore, beyond the scope of the main classification interfaces, the rich datasets behind the projects in new and different ways. As part of the three days of hacking, there will be a live chat with representatives from Galaxy Zoo, Planet Hunters, Snapshot Serengeti, and Planet Four (as well as a special guest or two) tomorrow Thursday July 11th at 2pm CDT ( 3 pm EDT, 8 pm BST). We’ll also give you an inside peek into the US Zooniverse Headquarters on the floor of the Adler Planetarium where much of the coding and development behind the Zooniverse happens.

You can find the video feed here on the blog. If you can’t watch live, the video is recorded and will be available to view later. If you have questions for the science teams you can post them in the comments or tweet @the_zooniverse


ZooTeach and Resources for the Classroom

Have you got your students whirling with excitement over Cyclone Center ?  Are they positively passionate about Planet Four?

Here in Zooniverse HQ, we like nothing better than hearing from teachers and educators about how you’re using Zooniverse projects in your classrooms and other learning environments.  Over the last year we’ve traveled to several conferences and meetings and heard about all kinds of innovative ways that teachers have put Zooniverse projects to use with their students.  We need you to share your amazing ideas!

ZooTeach is a companion website to Zooniverse containing lessons and resources aimed at helping teachers bring Zooniverse projects into their classrooms. Anybody can upload and share activities; you only need a Zooniverse login to contribute.  This fall we’ll have several new lessons and activities created as part of the Zooniverse Teacher Ambassadors Workshop to share with you.  We hope that you’ll consider sharing some of the ways that you’ve found to bring citizen science into your classroom or check-out ideas from other educators.

Welcome to the Worm Watch Lab

Today we launch a new Zooniverse project in association with the Medical Research Council (MRC) and the Medical Research Foundation: Worm Watch Lab.

We need the public’s help in observing the behaviour of tiny nematode worms. When you classify on wormwatchlab.org you’re shown a video of a worm wriggling around. The aim of the game is to watch and wait for the worm to lay eggs, and to hit the ‘z’ key when they do. It’s very simple and strangely addictive. By watching these worms lay eggs, you’re helping to collect valuable data about genetics that will assist medical research.

Worm Watch Lab

The MRC have built tracking microscopes to record these videos of crawling worms. A USB microscope is mounted on a motorised stage connected to a computer. When the worm moves, the computer analyses the changing image and commands the stage to move to re-centre the worm in the field of view. Because the trackers work without supervision, they can run eight of them in parallel to collect a lot of video! It’s these movies that we need the public to help classify.

By watching movies of the nematode worms, we can understand how the brain works and how genes affect behaviour. The idea is that if a gene is involved in a visible behaviour, then mutations that break that gene might lead to detectable behavioural changes. The type of change gives us a hint about what the affected gene might be doing. Although it is small and has far fewer cells than we do, the worm used in these studies (called C. elegans) has almost as many genes as we do! We share a common ancestor with these worms, so many of their genes are closely related to human genes. This presents us with the opportunity to study the function of genes that are important for human brain function in an animal that is easier to handle, great for microscopy and genetics, and has a generation time of only a few days. It’s all quite amazing!

To get started visit www.wormwatchlab.org and follow the tutorial. You can also find Worm Watch Lab on Facebook and on Twitter.

52 Years of Human Effort

At ZooCon last week I spoke about the scale of human attention that the Zooniverse receives. One of my favourite stats in this realm (from Clay Shirky’s book ‘Cognitive Surplus’) is that in the USA, adults cumulatively spend about 200 billion hours watching TV every year. By contrast it took 100 million hours of combined effort for Wikipedia to reach its status as the world’s encyclopaedia.

In the previous year people collectively spent just shy of half a million hours working on Zooniverse projects. Better put, the community invested about 52 years worth of effort[1]. That’s to say that if an individual sat down and did nothing but classify on Zooniverse sites for 52 years they’d only just have done the same amount of work as our community did between June 2012 and June 2013. The number is always rising too. Citizen science is amazing!

Another way of thinking about it is to convert this time into Full Time Equivalents (FTEs). One person working 40 hours per week, for 50 weeks a year works for 2000 hours a year – that’s 1 FTE. So our 460,000 hours of Zooniverse effort are equivalent to 230 FTEs. It’s as if we had a building with 230 people in who only came in every day to click on Zooniverse projects.

Zooniverse Effort Distribution to June 2013

This amazing investment by the community is not broken down evenly of course, as the above ‘snail’ chart shows. In fact Planet Hunters alone would occupy 62 of the people in our fictional building: the project took up 27% of the effort in the last year. Galaxy Zoo took 17%, which means it had almost 9 years of your effort all to itself. Planet Four had a meteoric launch on the BBC’s Stargazing Live less than six months ago and since that time it has gobbled up just over 5 years of human attention – 10% of the whole for the past year.

What’s wonderful is that our 230 metaphorical workers, and the 52 years they represent, are not confined to one building or one crazed click-worker. Our community is made of hundreds of thousands of individuals across the world – 850,000 of whom have signed up through zooniverse.org. Some of them have contributed a single classification, others have given our researchers far, far more of their time and attention. Through clicking on our sites, discussing ideas on Talk, or just spreading the word: Zooniverse volunteers are making a significant contribution to research in areas from astronomy to zoology.

Congratulations to everyone who’s taken part and let’s hope this number increases again by next year!

[1] In my ZooCon talk I incorrectly gave the figure of 35 years. This was wrong for two reasons; firstly, I had neglected Andromeda Project, Planet Four and Snapshot Serengeti for technical reasons. Secondly I had calculated the numbers incorrectly, in my rush to get my slides ready, and I underestimated them all by about 20%.

Anyone Fancy an Asteroid?

This could be the Asteroid Zoo logo
This might be the Asteroid Zoo logo

Anyone interested in astronomy on the web will be aware of the fabulous success of Planetary Resources’ fundraising effort to build and launch the ARKYD space telescope. They’ve already raised more than a million dollars – helped in part by a cunning plan to let you take a picture of yourself in space – but they’re not stopping there. With three days to go, we’re delighted to announce that they’re going to try and help us help Zooniverse volunteers hunt for potentially hazardous asteroids.

The latest stretch goal is to support the development by the Zooniverse of a citizen science asteroid hunt. If the new target is hit, we’ll build a system that uses more than 3 million images, taken data from the Catalina Sky Survey – the survey responsible for nearly half of the near Earth asteroid discoveries in the last fifteen years. We know there are asteroids out that are waiting to be discovered, and we’re willing to bet that the existing routines used to scan through the survey data didn’t find them all.

Recent discoveries of near-Earth objects; Catalina's the big purple part.
Recent discoveries of near-Earth objects; Catalina’s the big purple part.

Anyone who’s followed the Zooniverse over the last few years knows that we believe in doing projects that make authentic contributions to science, and so I’m especially pleased that the project with Planetary Resources is also focused on improving machine learning solutions to asteroid hunting. Rather like our supernova project, an ideal outcome would be to use the classifications provided by volunteers to improve automated searching and suggest new methods by which machines might take up the strain. In the meantime, though, there are new (small) worlds to find – with your help, we’ll be launching the search for them soon.

I’ve put my money where my mouth is already, and if you can afford it then I hope you’ll follow the link and donate so we can all go asteroid hunting. You can also watch their Kickstarter video to see what they’re trying to do.

PRI-KS-Banner-428x60

How the Zooniverse Works: Tools and Technologies

In my last post I described at length the domain model that we use to describe conceptually what the Zooniverse does. That wouldn’t mean much without an implementation of that model and so in this post I’m going to describe some of the tools and technologies that we use to actually run our citizen science projects.

The lifecycle of a Zooniverse project

Let’s think a little more about what happens when you visit a project such as Snapshot Serengeti. Ignoring all of the to-and-fro that your web browser does to work out where the domain name ‘snapshotserengeti.org’ points to, once it’s figured this and a few other details out you basically get sent a website that your browser renders for you. For the website to function as a Zooniverse project a few things are essential:

  1. You need to be able to view images (or listen to audio or watch a video) that we and the science team need your help analysing.
  2. You need to be able to log in with your Zooniverse account.
  3. We need to capture back what you said when doing the citizen science analysis task.
  4. Save out favourite images to your profile.
  5. View recent images you’ve seen in your profile.
  6. Discuss these images with the community.

It turns out that pretty much all of the functionality mentioned above is for us delivered by an application we call Ouroboros as an API layer and a website (such as Snapshot Serengeti) talking to it.

Screen Shot 2013-06-26 at 8.20.51 AM

Ouroboros – or ‘why the simplest API that works is probably all you need’.

So what is Ouroboros? It provides an API (REST/JSON) that allows you to build a Zooniverse project that has all of the core components (1-6) listed above. Technology-wise it’s a custom Ruby on Rails application (Rails 3.2) that uses MongoDB to store data and Redis as a query cache all running on Amazon Web Services. It’s probably utterly useless to anyone but us but for our needs it’s just about perfect.

Screen Shot 2013-06-26 at 8.01.30 AM

At the Zooniverse we’re optimised for a few different things. In no particular order of priority they are:

  1. Volume – we want to be able to build lots of projects.
  2. Science – we want it to be easy to do science with the efforts of our community.
  3. Scale/performance – we want to be able to have millions of people come to our proejcts and them to stay up.
  4. Availability – we’d prefer our websites to be ‘up’ and not ‘down’.
  5. Cost – we want to keep costs at a manageable level.

Pretty much all of these requirements point to having a shared API (Ouroboros) that serves a large number of projects (I’ll argue #4 in the pub with anyone who really wants to push me on it).

Running a core API that serves many projects makes you take the maintenance and health of that application pretty seriously. Should Ouroboros throw a wobbly then we’d currently take out about 10 Zooniverse projects at once and this is only set to increase. This means we’ve thought a lot about how to scale the application for times when we’re busy and we also spend significant amounts of time monitoring the application performance and tuning code where necessary. I mentioned that cost is a factor – running a central API means that when the Zooniverse is quiet and there aren’t many people about we can scale back the number of servers we’re running (automagically on Amazon Web Services) to a minimal level.

We’ve not always built our projects this way. The original Galaxy Zoo (2007) was an ASP/web forms application, projects between Galaxy Zoo 2 and SETI Live were all separate web applications, many of them built using an application called The Juggernaut. Building standalone applications every time not only made it difficult to maintain our projects but we also found ourselves writing very similar (but subtly different) code many times between projects, code for things like choosing which Subject to show next.

Ouroboros is an evolution of our thinking about how to build projects, what’s important and generalisable and what isn’t. At it’s most basic it’s a really fast Subject allocator and Classification collector. Our realisation over the last few years was that the vast majority of what’s different about each project is the user experience and classification interface and this has nothing to do with the API.

Subjects out, Classifications back in.

The actual projects

The point of having a central API is that when we want to build a new project we’re already working with a very familiar toolset – the way we log people in, do signup forms, ask for a Subject, send back Classifications – all of this is completely standard. In fact if you’re building in JavaScript (which we almost always are these days) then there’s a client library called ‘Zooniverse’ (meta I know) available here on GitHub.

Having a standard API and client library for talking to it meant that we built the Zooniverse project Planet Four in less than 1 week! That’s not to say it’s trivial to build projects, it’s definitely not, but it is getting easier. And having this standardised way of communicating with the core Zooniverse means that the bulk of the effort when building Planet Four was exactly where it should be – the fan drawing tools – the bit that’s different from any of our other projects.

Screen Shot 2013-06-26 at 8.19.22 AM

So how do we actually build our projects these days? We build our projects as JavaScript web applications using JavaScript web frameworks such as Spine JS, Backbone or something completely custom. The point being, that all of the logic for how the interface should behave is baked into the JavaScript application – Ouroboros doesn’t try and help with any of this stuff.

Currently the majority of our projects are hosted using the Amazon S3 static website hosting service. The benefits of this are numerous but key ones for us are:

  1. There’s no webserver serving the site content, that is http://www.galaxyzoo.org resolves to an S3 bucket. When you access the Galaxy Zoo site S3 does all of the hard work and we just pay for the bandwidth from S3 to your computer.
  2. Deploying is easy. When we want to put out a new version of any of our sites we just upload new timestamped versions of the files and your browser starts using them instead.
  3. It’s S3 – Amazon S3 is a quite remarkable service –  a significant fraction of the web is using it. Currently hosting more than 2 trillion (yes that’s 12 zeroes) objects and regularly serving more than 1 million requests for data per second the S3 service is built to scale and we get to use it (and so can you).

Amazon S3 is a static webhost (i.e. you can’t have any server-side code running) so how do we make a static website into a Zooniverse project you can log in to when we can’t access database records? The main site functions just fine – these JavaScript applications (such as the current Galaxy Zoo or any recent Zooniverse project) implement what is different about the project’s interface. We then use a small invisible iFrame on each website that actually points to api.zooniverse.org which is Ouroboros. When you use a login form we actually set a cookie on this domain and then send all of our requests back to the API through this iFrame. This approach is a little unusual and with browsers tightening up the restrictions on third-party cookies if looks like we might need to swap it out for a different approach but for now it’s working well.

Summing up

If you’re like me then when you read something you read the opening, look at the pictures and then skip to the conclusions. I’ll summarise here just incase you’re doing that too:

In the Zooniverse there’s a clear separation between the API (Ouroboros) and the citizen science projects that the community interact with. Ouroboros is a custom-built, highly scalable application built in Ruby on Rails, that runs on Amazon Web Services and uses MongoDB, Redis and a few other fancy technologies to do its thing.

The actual citizen science projects that people interact with are these days all pure JavaScript applications that are hosted on Amazon S3 and they’re pretty much all open source. They’re generally still bespoke applications each time but share common code for talking to Ouroboros.

What I didn’t talk about in this post are the hardest bits we’ve solved in Ouroboros – namely all of the logic about how to make finding Subjects for people quickly and other ‘smart stuff’. That’s coming up next.

The world's largest and most popular platform for people-powered research. This research is made possible by volunteers—millions of people around the world who come together to assist professional researchers.