In this edition of our Who’s who in the Zoo series meet Shaun, a frontend developer here at the Zooniverse. Grab a cuppa and have a read 🙂
– Helen

Name: Shaun A. Noordin
Location: Oxford, UK
Tell us about your role within the team:
I’ve been a frontend web developer since the ancient era of 2017, and I’ve been responsible for building and updating (and occasionally accidentally breaking) various features on the website. If it’s something visible on a Zooniverse webpage, I’ve probably tinkered with it.
What did you do in your life before the Zooniverse?
In between playing Super Mario and Zelda, I somehow managed to earn a Bachelor of Computer degree and landed a job as a web developer at a Malaysian news company. I then decided to move to the UK, partially to earn my MBA & find a new job, and partially because nobody else in my home country appreciates tea as much as I do.
What does your typical working day involve?
I start the day by saying hello to my awesome colleagues on Slack and find out what’s happening. Cat GIFs and emojis 🤪 are used to properly convey important technical information. Most of the day will be spent in front of a computer screen, looking at issues on Github https://github.com/zooniverse/ , debugging problems on the website, and submitting updates to our shared code base. Tea will be had throughout the day, because there is always time for tea.
How would you describe the Zooniverse in one sentence?
It’s people working with people to work on science to make the world a slightly better place, and it is awesome.
Tell us about the first Zooniverse project you were involved with
I built WildCam Gorongosa Lab, which was the supplementary educational website to the (then standalone) WildCam Gorongosa project. WildCam Gorongosa Lab eventually became a template for other camera trap-based educational programs, which are now available on Zooniverse Classroom: https://classroom.zooniverse.org/
Of all the discoveries made possible by the Zooniverse, which for you has been the most notable? (and why?)
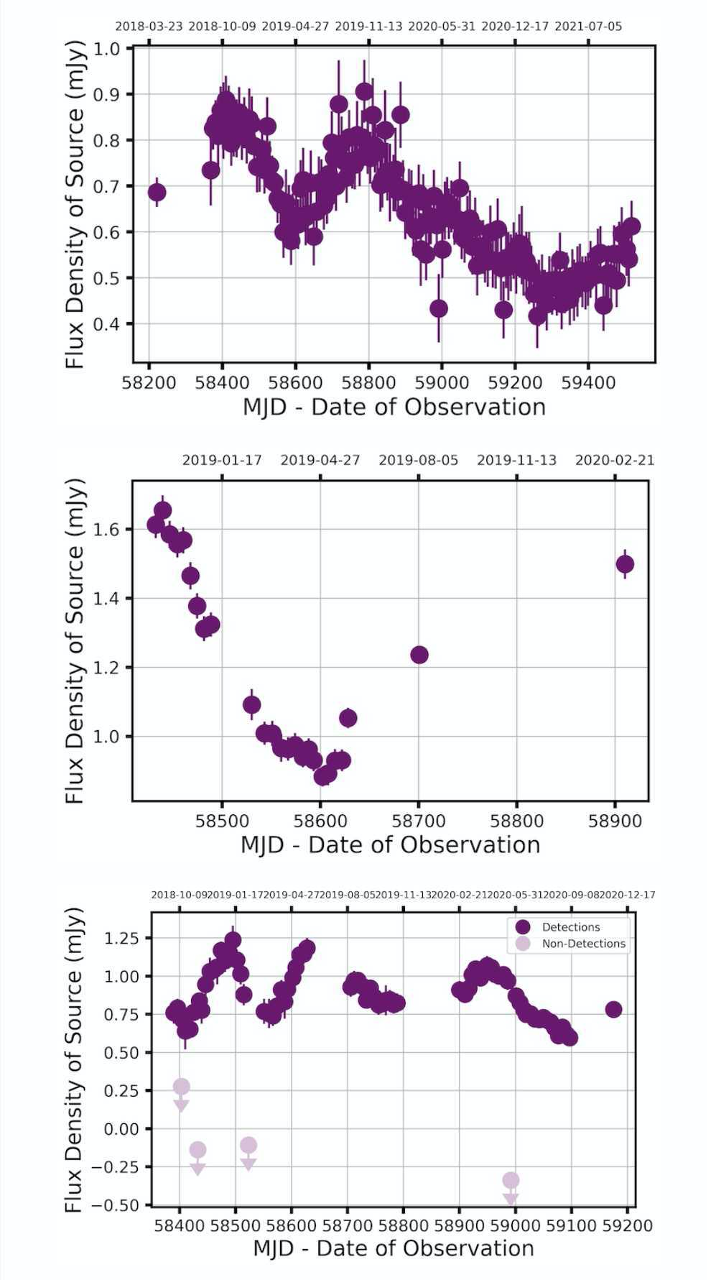
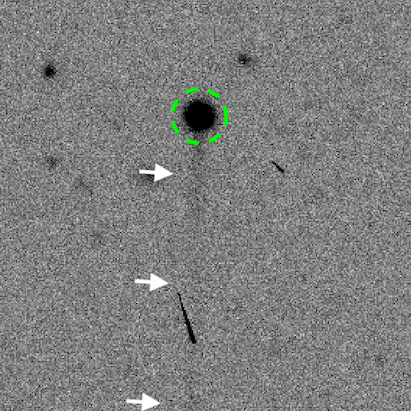
I’m particularly impressed by the discovery of exoplanets, as with Planet Hunters TESS. Now, I’m sure the amazing astronomy nerds I work with might find the knowledge & technique pretty standard, but I was personally amazed to learn how – by observing the light of distant stars over a period of time and finding out when they regularly decrease in brightness – we could discover planets in distant galaxies.
What’s been your most memorable Zooniverse experience?
The semi-regular Zooniverse Team Meetings are always a highlight. I work regularly with my friends & colleagues from across the UK and USA, but I don’t always get to meet them… until the ZTM brings us all together in one place. It’s a great time to discuss project plans, plan long-term technical solutions together, swap jokes, and debate what’s the best kind of tea. (Japanese green tea with slices of strawberries, for a blend of light freshness and sweet fruitiness.)
What are your top three citizen science projects?
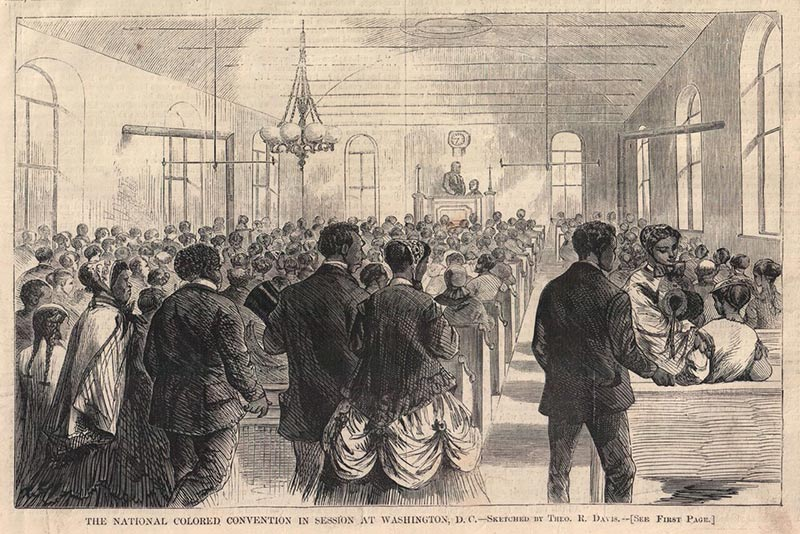
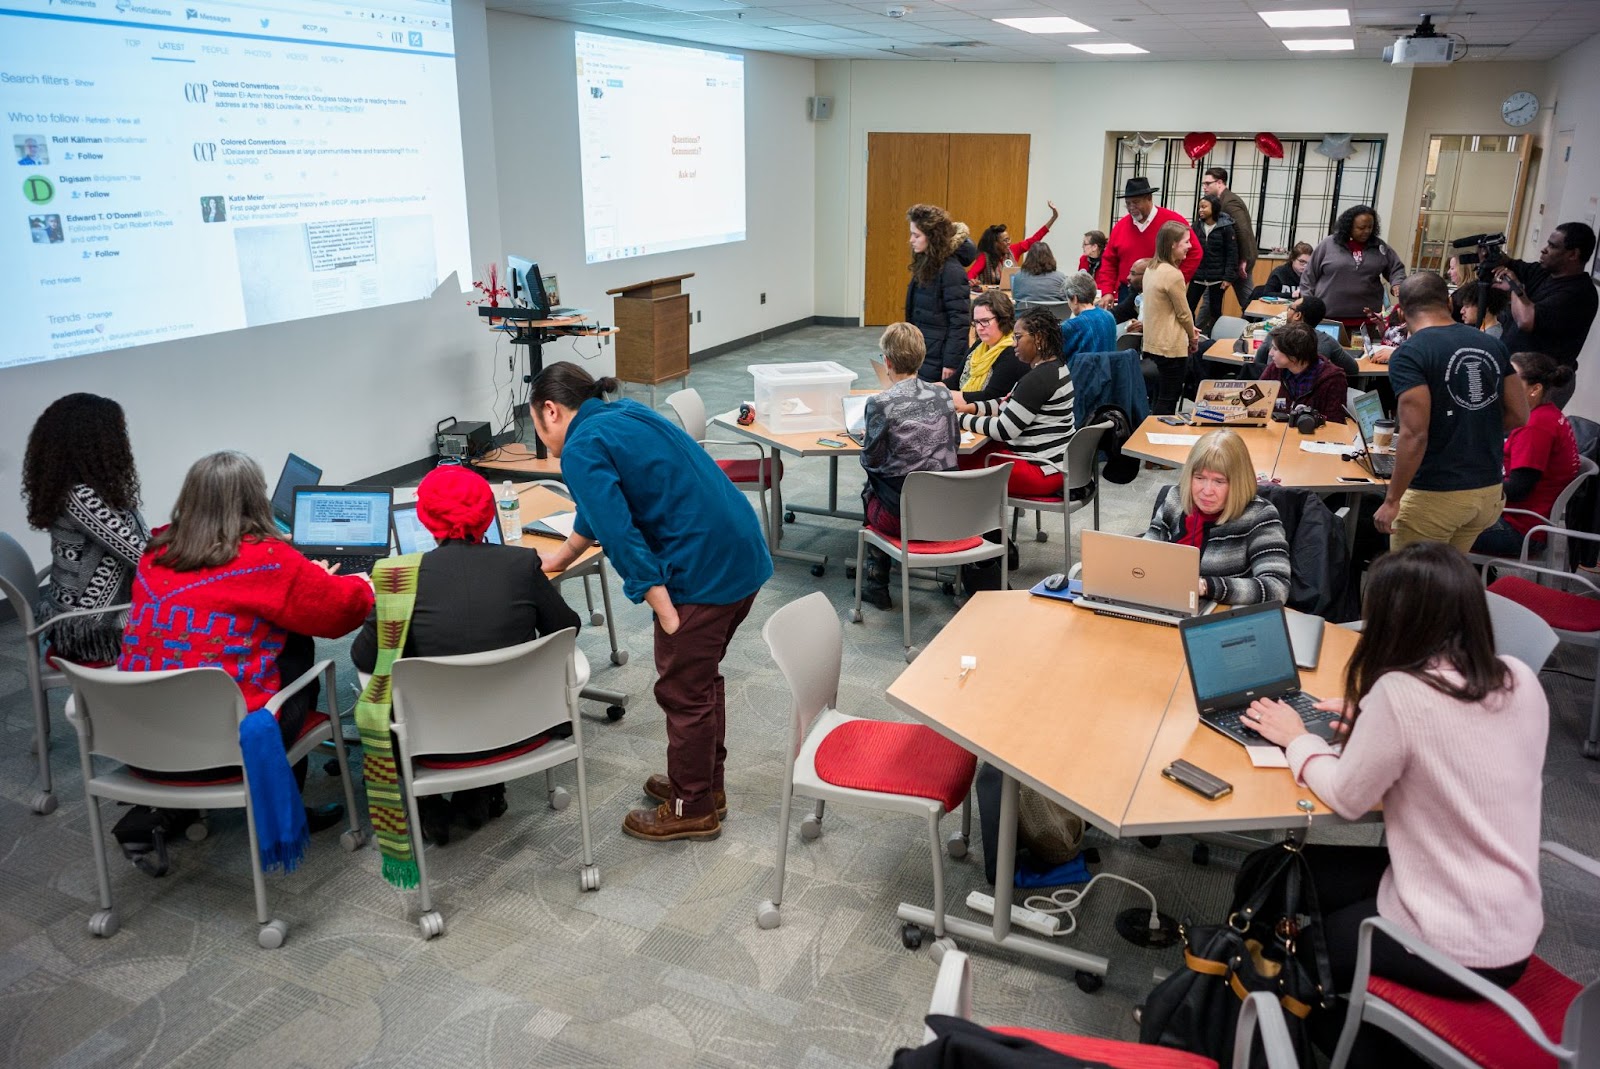
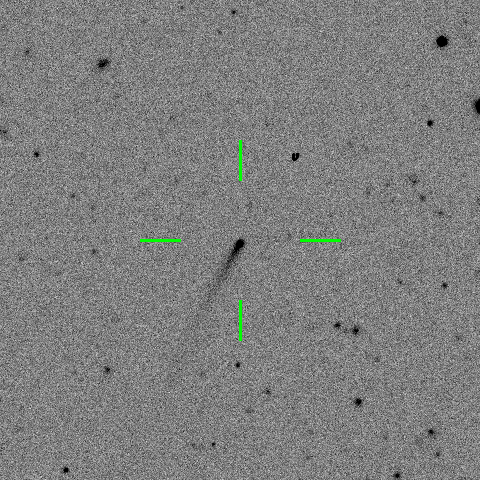
WildCam Gorongosa has a special place in my heart as it’s one of the earliest projects I’ve been involved in. Creating WCG Lab was a great experience in understanding how the Zooniverse team worked, and the independence and initiative I’m given as a developer. As for the other top two, that’d be Planet Hunters TESS (because I built its unique light curve viewer component) and Anti-Slavery Manuscripts (because I helped build our first transcription project and learnt a lot of things along the way).
What advice would you give to a researcher considering creating a Zooniverse project?
When building a project, I’d share the same advice as writing code: start small and create a proof of concept first. Afterwards, keep iterating by making small and discrete changes until you reach your goal – and always test what you’ve built at each major step. Also, take consistent tea breaks.
How can someone who’s never contributed to a citizen science project get started?
As a complete introvert who’s always wary of social interaction, believe me when I say: just jump in. Or with more detail: if you’re interested in something, jump in, read all the instructions, be nice to the people you meet, and don’t be too shy to ask questions. If you’re afraid of making mistakes or not knowing what to do, don’t be – skills and knowledge can be gained with patience, but that enthusiasm you have to learn and contribute is something special that should be nurtured.
Where do you hope citizen science and the Zooniverse will be in 10 years time?
In space. I can’t wait to work in a zero-G office orbiting our planet, though admittedly the cost of the commute would be through the stratosphere. (But seriously: I hope the Zooniverse becomes more open and accessible to more people throughout the world. We’re doing a lot of work on adding language support and improving accessibility, but there’s still more to do.)
Is there anything in the Zooniverse pipeline that you’re particularly excited about?
We always have a few fun experiments from our monthly hackdays, but not all of them end up ready to enter the full production pipeline, alas. My favourite was an unimplemented “voice command mode” where you could classify images by screaming at your computer, “MONKEYS!” “FIVE!” “DANCING!” “DONE & SUBMIT!”. It would have been a great way to allow for hands-free volunteer classifications as well as make your neighbours wonder what is happening in your home.
When not at work, where are we most likely to find you?
When I’m not in front of a screen doing work, I’m in a front of a screen playing video games. I also draw comics (on a tablet PC), write technical articles (on a PC), and make my own games (again on a PC). 90% of my waking hours is spent staring at glowing rectangles, and if you know which The Onion article that joke was in reference to, I think we’ll get along just fine.
Do you have any party tricks or hidden talents?
I studied Japanese so I could better understand my favourite video games, but then I learnt that Mario is actually Italian. Argh! Boku wa baka desu!!
Is there anything else you’d like to share?
I have no links to share, but I wanted to say thanks for reading all the way to the end. I know that not everyone understands my odd sense of humour, but this is why I love working here at the Zooniverse. My friends and colleagues are great people who encourage me to embrace my weirdness and eccentricities, because they trust that I always have everyone’s best interests at heart. This, in turn, motivates me to work hard to help build a better website for everyone. On that note, I hope you too find yourself welcome here in the Zooniverse!