Guest post from Eilidh O’Brien, Staff Scientist, Whales of Iceland Museum
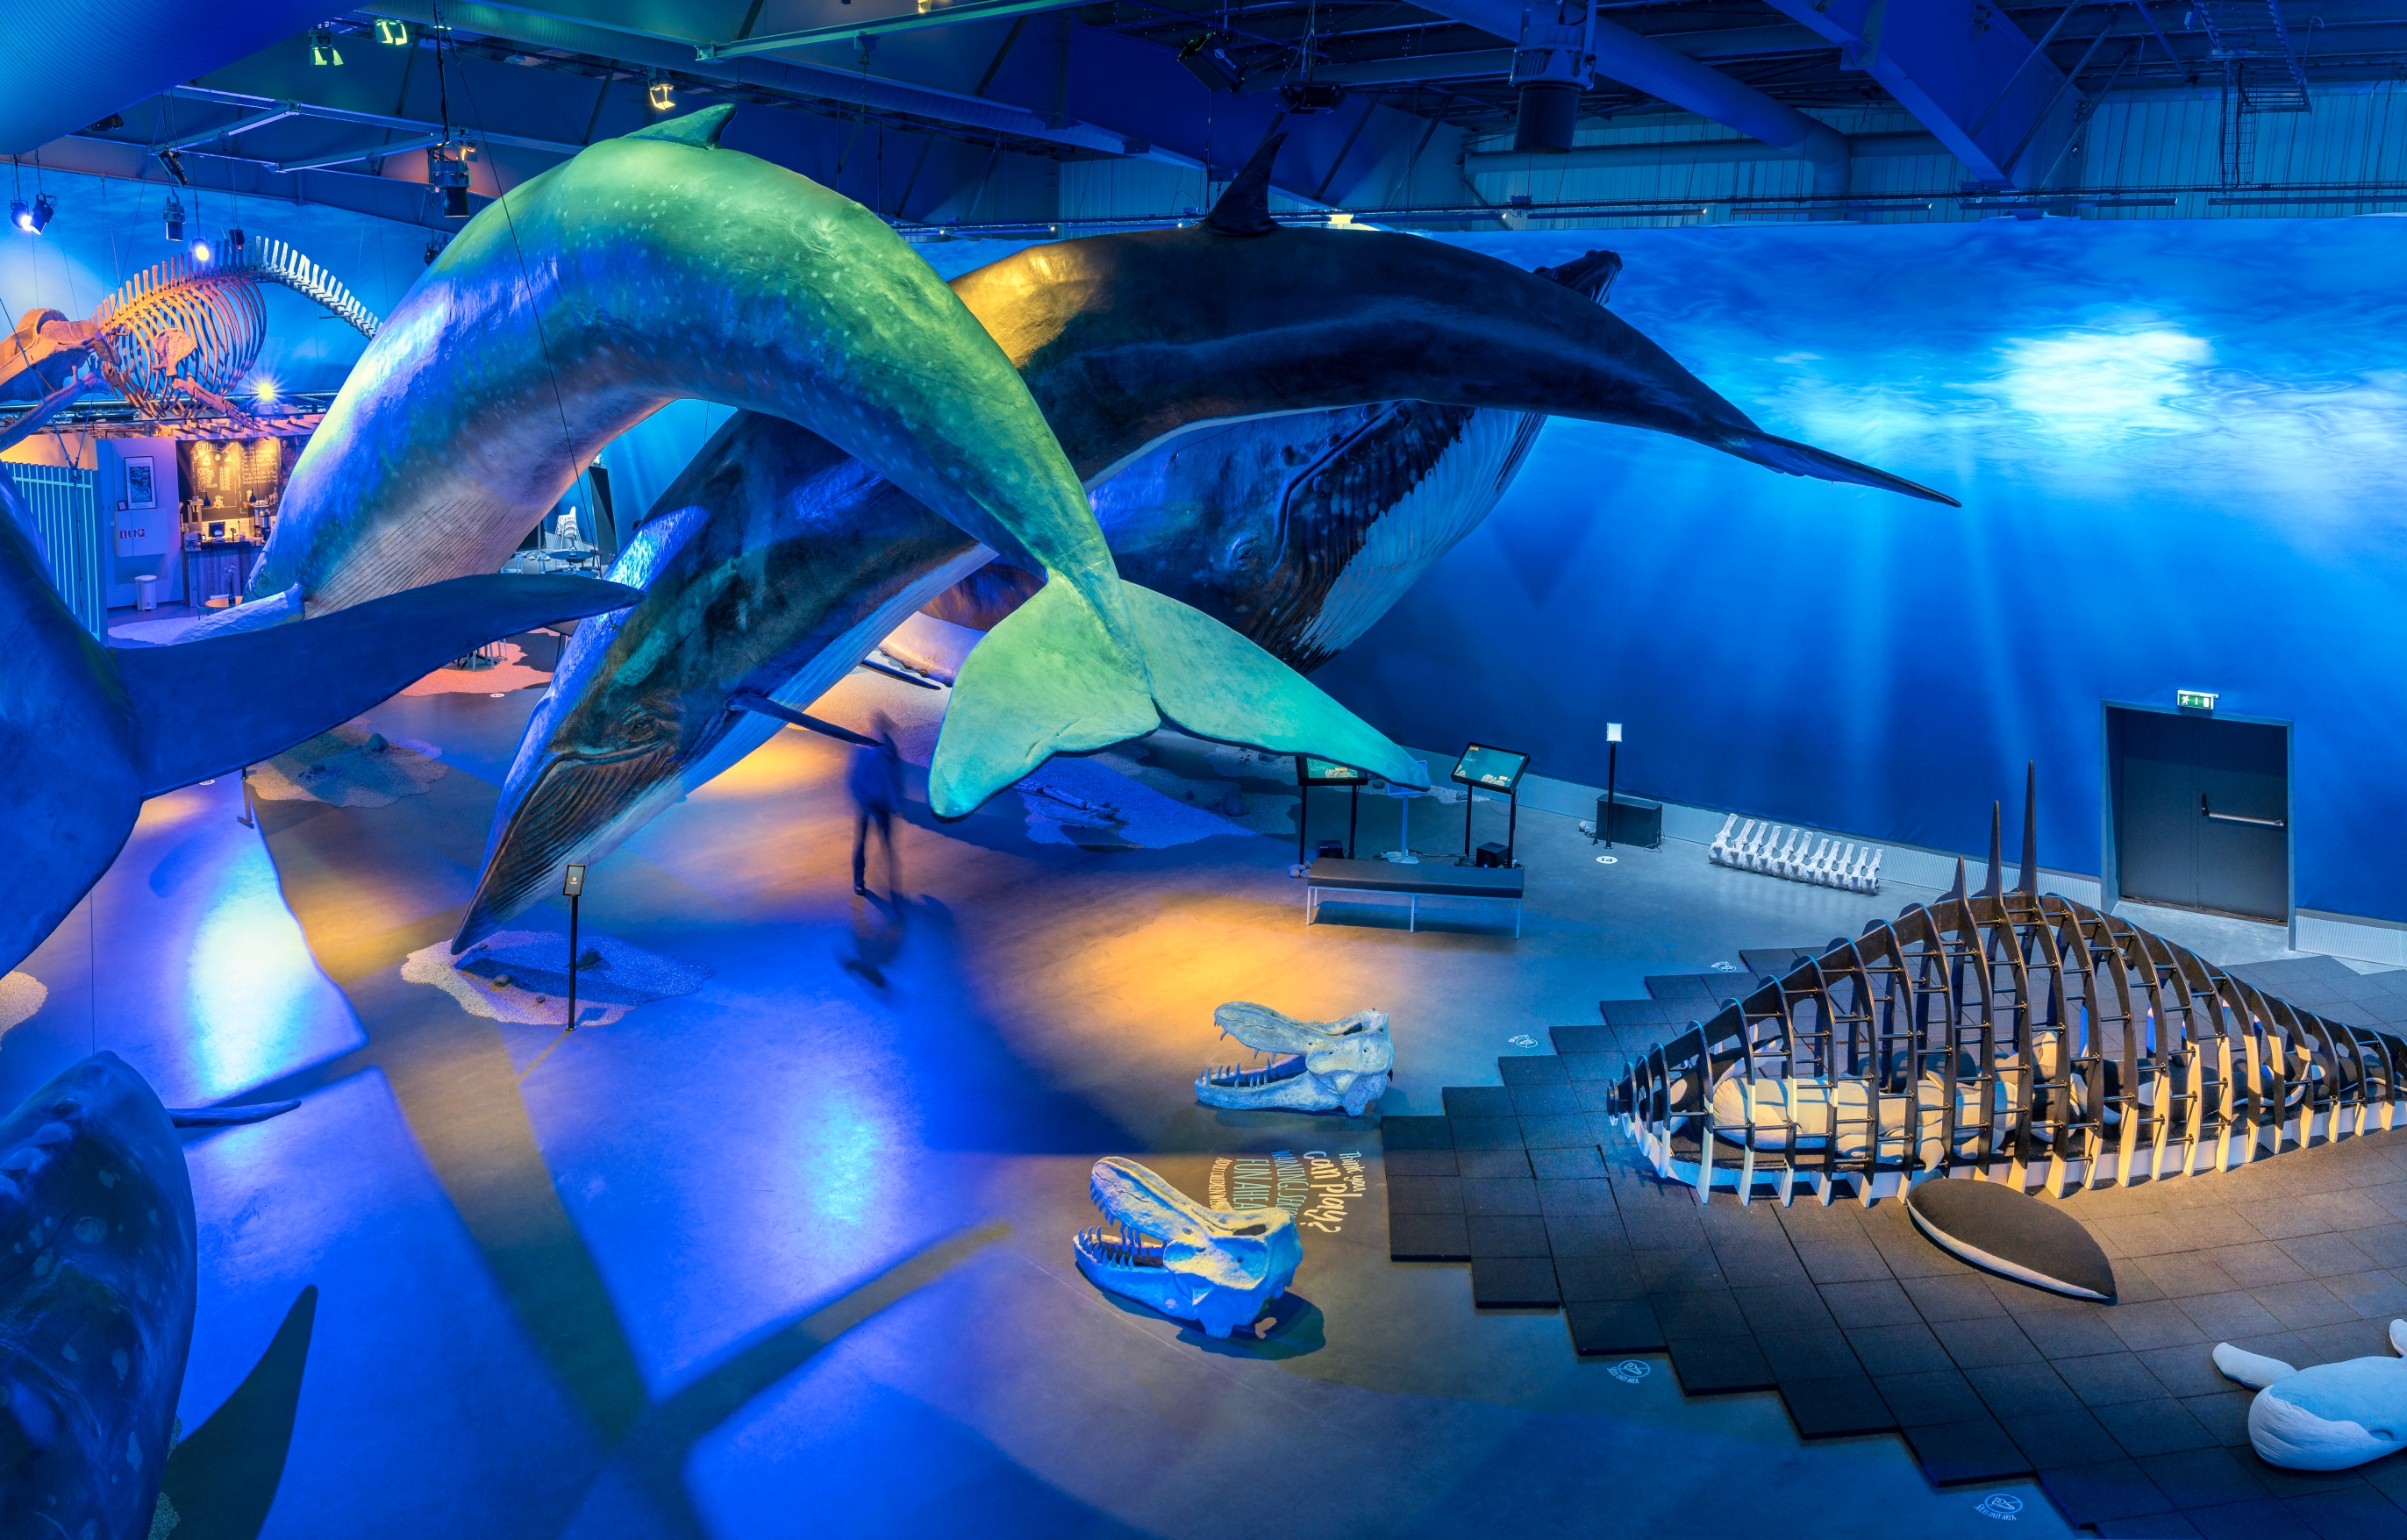
Appropriately located in Reykjavík’s harbour district, Whales of Iceland is the largest museum dedicated to cetaceans in Europe. Much of the space inside is dedicated to life-sized models of the 23 species of whales, dolphins and porpoises that have been sighted in the waters around Iceland throughout history, some very common while others are very rare. When the museum was founded these models were the main focus of the exhibition: a chance for visitors to experience the true size of these gigantic marine animals, and to learn a little about each of the species on display. However, this focus is now evolving and Zooniverse is set to play an important part.
Iceland is a hotspot for cetaceans – and so, also for cetacean researchers! Some remarkable discoveries have been made here in the last decade, from the first recordings of humpback whales singing in their feeding grounds over winter, to the unusual antagonistic interactions between killer whales and long-finned pilot whales. We want to highlight this at Whales of Iceland so that our museum is not just a place to learn about cetaceans themselves, but also how scientists study these fascinating and complex animals, what this research has uncovered, and all the things that we still do not know!
In addition to learning about the research happening here in Iceland, we want to give visitors the opportunity to take part in some real scientific projects. So, thanks to Zooniverse, our newest exhibit will include a citizen science station where anyone can have a shot at being a scientist! We will feature a range of Zooniverse projects for visitors to choose from, giving them a variety of different marine mammal species and different aspects of wildlife ecology to learn about.
Our aim is to make Whales of Iceland a more interactive and thought-provoking experience. We hope that our museum will continue to offer visitors the chance to marvel at the size and beauty of these wonderful creatures, but also to engage with the natural world in ways they may not have before, and to feel that they have not just learned, but discovered.
This collaboration is still in its early stages. With the green light from Zooniverse Co-PI Dr. Laura Trouille, we have already launched a scaled-down version of what we hope the final exhibit will be, and it has been a really promising success! Museums provide a perfect platform for citizen science; we are a small museum relatively speaking, but our footfall in peak season can be more than 400 people in a day. That’s a lot of potential citizen scientists! In ecology, we would call this a mutualistic symbiosis – or, in other words, everyone wins! Our museum guests can provide valuable contributions to scientific projects all over the world, while at the same time gaining first-hand insight into the life of a whale researcher.
We are so excited to develop and expand our collaboration with Zooniverse, as well as other citizen science initiatives. Our finished research exhibit will be unveiled very soon – watch this space!
In this edition of our Who’s who in the Zoo series meet Shaun, a frontend developer here at the Zooniverse. Grab a cuppa and have a read 🙂
– Helen
Name: Shaun A. Noordin
Location: Oxford, UK
Tell us about your role within the team:
I’ve been a frontend web developer since the ancient era of 2017, and I’ve been responsible for building and updating (and occasionally accidentally breaking) various features on the website. If it’s something visible on a Zooniverse webpage, I’ve probably tinkered with it.
What did you do in your life before the Zooniverse?
In between playing Super Mario and Zelda, I somehow managed to earn a Bachelor of Computer degree and landed a job as a web developer at a Malaysian news company. I then decided to move to the UK, partially to earn my MBA & find a new job, and partially because nobody else in my home country appreciates tea as much as I do.
What does your typical working day involve?
I start the day by saying hello to my awesome colleagues on Slack and find out what’s happening. Cat GIFs and emojis 🤪 are used to properly convey important technical information. Most of the day will be spent in front of a computer screen, looking at issues on Github https://github.com/zooniverse/ , debugging problems on the website, and submitting updates to our shared code base. Tea will be had throughout the day, because there is always time for tea.
How would you describe the Zooniverse in one sentence?
It’s people working with people to work on science to make the world a slightly better place, and it is awesome.
Tell us about the first Zooniverse project you were involved with
I built WildCam Gorongosa Lab, which was the supplementary educational website to the (then standalone) WildCam Gorongosa project. WildCam Gorongosa Lab eventually became a template for other camera trap-based educational programs, which are now available on Zooniverse Classroom: https://classroom.zooniverse.org/
Of all the discoveries made possible by the Zooniverse, which for you has been the most notable? (and why?)
I’m particularly impressed by the discovery of exoplanets, as with Planet Hunters TESS. Now, I’m sure the amazing astronomy nerds I work with might find the knowledge & technique pretty standard, but I was personally amazed to learn how – by observing the light of distant stars over a period of time and finding out when they regularly decrease in brightness – we could discover planets in distant galaxies.
What’s been your most memorable Zooniverse experience?
The semi-regular Zooniverse Team Meetings are always a highlight. I work regularly with my friends & colleagues from across the UK and USA, but I don’t always get to meet them… until the ZTM brings us all together in one place. It’s a great time to discuss project plans, plan long-term technical solutions together, swap jokes, and debate what’s the best kind of tea. (Japanese green tea with slices of strawberries, for a blend of light freshness and sweet fruitiness.)
What are your top three citizen science projects?
WildCam Gorongosa has a special place in my heart as it’s one of the earliest projects I’ve been involved in. Creating WCG Lab was a great experience in understanding how the Zooniverse team worked, and the independence and initiative I’m given as a developer. As for the other top two, that’d be Planet Hunters TESS (because I built its unique light curve viewer component) and Anti-Slavery Manuscripts (because I helped build our first transcription project and learnt a lot of things along the way).
What advice would you give to a researcher considering creating a Zooniverse project?
When building a project, I’d share the same advice as writing code: start small and create a proof of concept first. Afterwards, keep iterating by making small and discrete changes until you reach your goal – and always test what you’ve built at each major step. Also, take consistent tea breaks.
How can someone who’s never contributed to a citizen science project get started?
As a complete introvert who’s always wary of social interaction, believe me when I say: just jump in. Or with more detail: if you’re interested in something, jump in, read all the instructions, be nice to the people you meet, and don’t be too shy to ask questions. If you’re afraid of making mistakes or not knowing what to do, don’t be – skills and knowledge can be gained with patience, but that enthusiasm you have to learn and contribute is something special that should be nurtured.
Where do you hope citizen science and the Zooniverse will be in 10 years time?
In space. I can’t wait to work in a zero-G office orbiting our planet, though admittedly the cost of the commute would be through the stratosphere. (But seriously: I hope the Zooniverse becomes more open and accessible to more people throughout the world. We’re doing a lot of work on adding language support and improving accessibility, but there’s still more to do.)
Is there anything in the Zooniverse pipeline that you’re particularly excited about?
We always have a few fun experiments from our monthly hackdays, but not all of them end up ready to enter the full production pipeline, alas. My favourite was an unimplemented “voice command mode” where you could classify images by screaming at your computer, “MONKEYS!” “FIVE!” “DANCING!” “DONE & SUBMIT!”. It would have been a great way to allow for hands-free volunteer classifications as well as make your neighbours wonder what is happening in your home.
When not at work, where are we most likely to find you?
When I’m not in front of a screen doing work, I’m in a front of a screen playing video games. I also draw comics (on a tablet PC), write technical articles (on a PC), and make my own games (again on a PC). 90% of my waking hours is spent staring at glowing rectangles, and if you know which The Onion article that joke was in reference to, I think we’ll get along just fine.
Do you have any party tricks or hidden talents?
I studied Japanese so I could better understand my favourite video games, but then I learnt that Mario is actually Italian. Argh! Boku wa baka desu!!
Is there anything else you’d like to share?
I have no links to share, but I wanted to say thanks for reading all the way to the end. I know that not everyone understands my odd sense of humour, but this is why I love working here at the Zooniverse. My friends and colleagues are great people who encourage me to embrace my weirdness and eccentricities, because they trust that I always have everyone’s best interests at heart. This, in turn, motivates me to work hard to help build a better website for everyone. On that note, I hope you too find yourself welcome here in the Zooniverse!
We recently fixed a security vulnerability whereby an attacker could upload executable content to our media storage domains.
On 13th November 2022, a security researcher notified us of a cross-site scripting (XSS) vulnerability affecting our media storage domains. This XSS vulnerability made it possible for attackers to upload content to our storage domains that could then be shared as links for use in ‘phishing’ or other attacks.
We fixed the vulnerability on the morning of the 15th November 2022 by blocking script access to the API from the impacted domains ensuring any malicious code failed to gain access to authenticated private data. This remedial action was followed by a another fix on the 16th November that deployed block rules on our Content Distribution Network (CDN) provider to prevent malicious resource links being served to users. In addition, on the 8th of December we deployed a change to the API to only allow non-malicious files to be uploaded to these storage domains.
The mitigation and fix steps described above allowed us time to research the problem and audit our storage systems for any live exploits. After this audit we determined that this vulnerability had not been exploited for any malicious purpose; no data was leaked and no users were exposed to injected code.
This is a guest post by summer intern Anastasia Unitt.
The study of celestial objects creates a huge amount of data. So much data, that astronomers struggle to make use of it all. The solution? Citizen scientists, who lend their brainpower to analyse and catalogue vast swathes of information. Alex Andersson, a DPhil student at the University of Oxford, has been applying this approach to his field: radio astronomy, through the Zooniverse. I met with him via Zoom to learn about his project detecting rare, potentially explosive events happening far out in space.
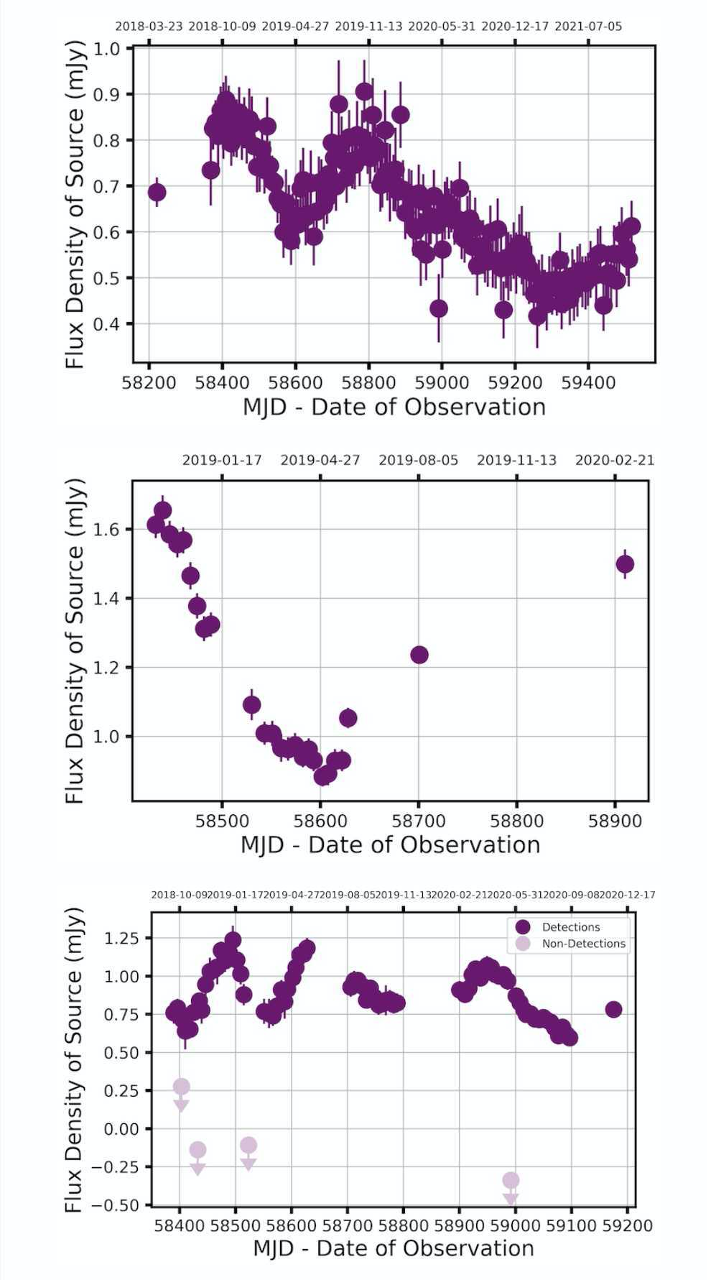
Alex’s research uses data collected by a radio telescope located thousands of miles away in South Africa, named MeerKAT. The enormous dishes of the telescope detect radio waves, captured from patches of sky about twice the size of the full Moon. This data is then converted into images, which show the source of the waves, and into light curves, a kind of scatter plot which depicts how the brightness of these objects has changed over time. This information was initially collected for a different project, so Alex is exploiting the remaining information in the background- or, as he calls it: “squeezing science out of the rest of the picture.” The goal: to identify transient sources in the images, things that are changing, disappearing and appearing.
Historically, relatively few of these transients have been identified, but the many extra pairs of eyes contributed by citizen scientists has changed the game. The volume of data analysed can be much larger, the process far faster. Alex is clearly both proud of and extremely grateful to his flock of amateur astronomers. “My scientists are able to find things that using traditional methods we just wouldn’t have been able to find, [things] we would have missed.” The project is ongoing, but his favourite finding so far took the form of a “blip” his citizen scientists noticed in just two of the images (out of thousands). Alex explains: “We followed it up and it turns out it’s this star that’s 10 times further away than our nearest stellar neighbor, and it’s flaring. No one’s ever seen it with a radio telescope before.” His excitement is obvious, and justified. This is just one of many findings that may be previously unidentified stars, or even other kinds of celestial objects such as black holes. There’s still so much to find out, the possibilities are almost endless.
A range of light curve shapes spotted by Zooniverse citizen scientists performing classifications for Bursts from Space: MeerKAT
Unfortunately, research comes with its fair share of frustrating moments along with the successes. For Alex, it’s the process of preparing the data for analysis which has proved the most irksome. “Sometimes there’s bits in the process that take a long time, particularly messing with code. There can be so much effort that went into this one little bit, that even if you did put it in a paper is only one sentence.” These behind-the-scenes struggles are essential to make the data presentable to the citizen scientists in the first place, as well as to deal with the thousands of responses which come out the other side. He assures me it’s all worth it in the end.
As to where this research is headed next, Alex says the prospects are very exciting. Now they have a large bank of images that have been analysed by the citizen scientists, he can apply this information to train machine learning algorithms to perform similar detection of interesting transient sources. This next step will allow him to see “how we can harness these new techniques to apply them to radio astronomy – which again, is a completely novel thing.”
Alex is clearly looking forward to these further leaps into the unknown. “The PhD has been a real journey into lots of things that I don’t know, which is exciting. That’s really fun in and of itself.” However, when I ask him what his favourite part of this research has been so far, it isn’t the science. It’s the citizen scientists. He interacts with them directly through chat boards on the Zooniverse site, discussing findings and answering questions. Alex describes their enthusiasm as infectious – “We’re all excited about this unknown frontier together, and that has been really, really lovely.” He’s already busy preparing more data for the volunteers to examine, and who knows what they might find; they still have plenty of sky to explore.
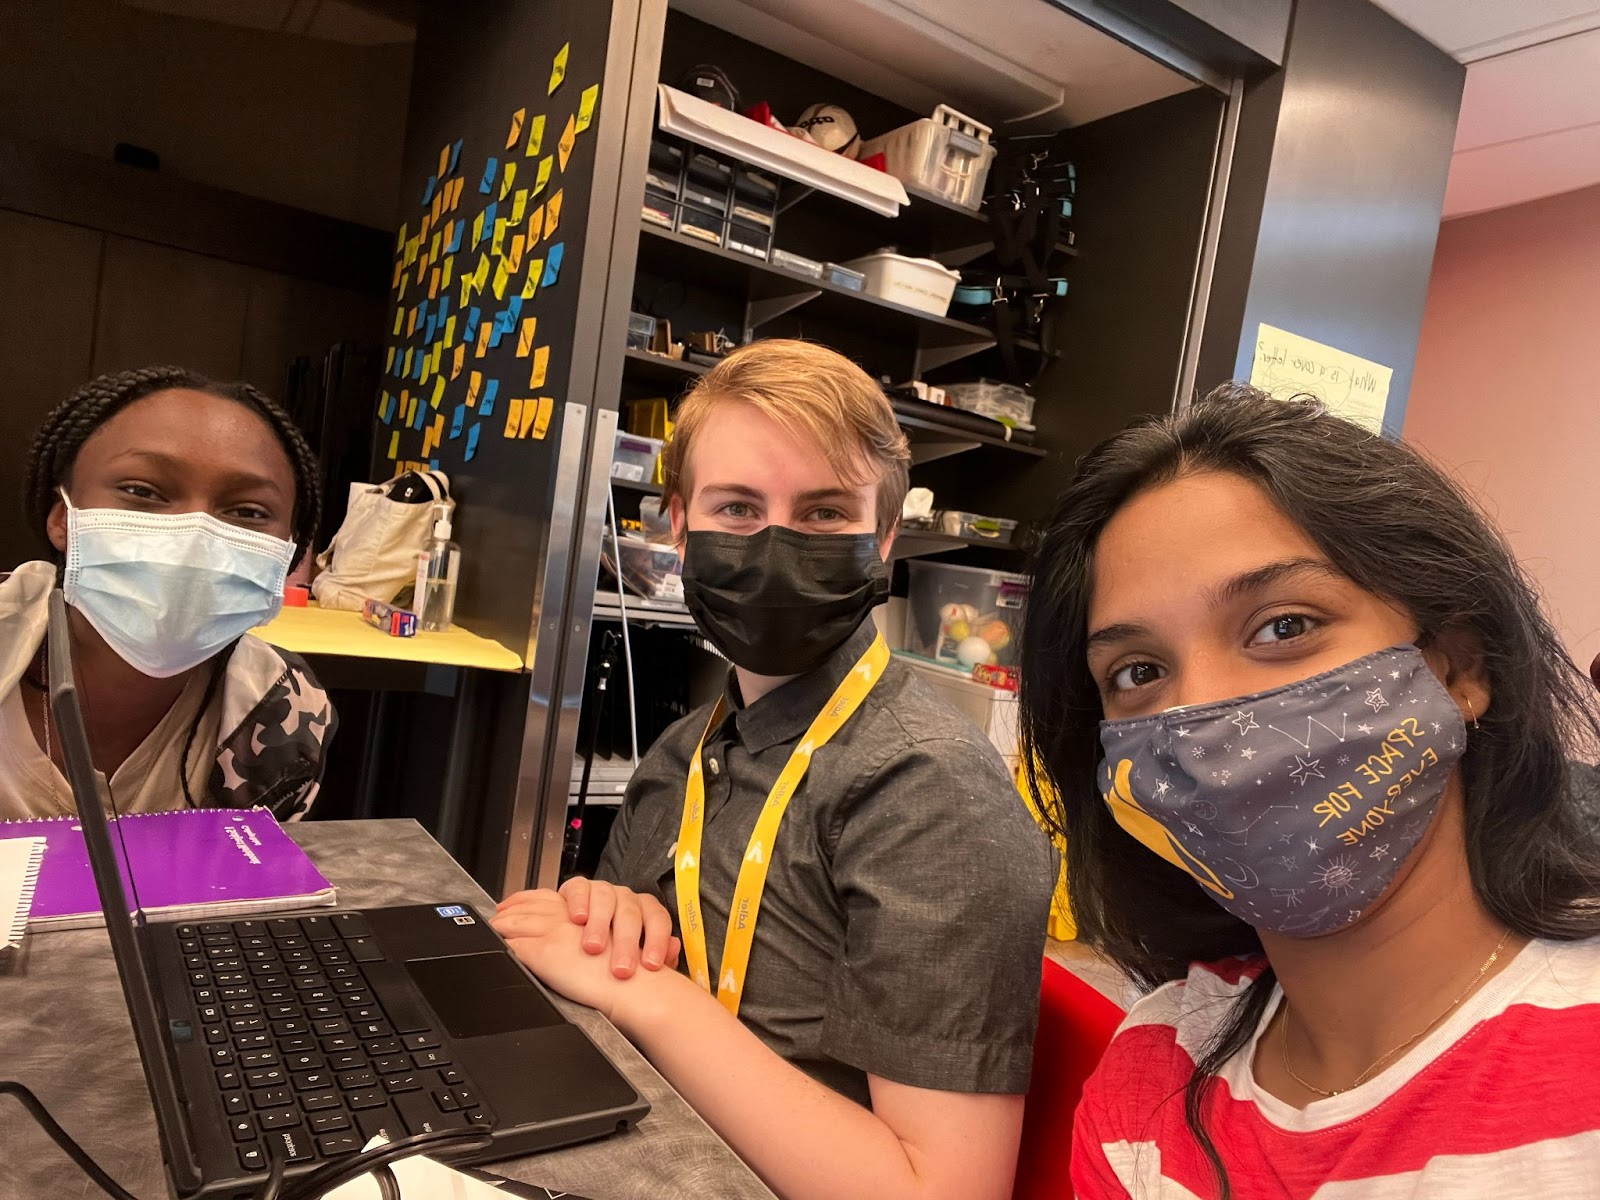
By Tasnova, Guest Writer and Adler Zooniverse Summer ’22 Teen Intern
This summer, I worked as an intern for the Adler Planetarium in Chicago, alongside Lola Fash and Dylan. As a group, we carried out Zooniverse projects and interviews with the researchers leading them. In this blog post, I will share about my experience with the main project that I took part in: Transcribe Colored Conventions.
In July 2022 I interviewed Dr. Jim Casey and Justin Smith, two of the research leads for the Colored Conventions project with Zooniverse. Dr. Casey is an assistant research professor of African American Studies at Penn State University, managing director of the Center for Black Digital Research, and co-founder for the Colored Conventions project. Justin Smith is a Ph.D. candidate in English and African American studies at Penn State and a member of the Douglass Day team.
Before I dig into what the Colored Conventions were, I’d like to share my own experience while working on these projects. I chose to focus on Transcribe Colored Convention because I am a huge history lover. I want to learn everything; learning feeds my curiosity. I was really excited to learn about the Colored Conventions since they are often neglected in textbooks; my school never taught me about the Colored Conventions. It was my first time learning anything about the Colored Conventions. I was so excited to get to interview the amazing people leading the Zooniverse project to transcribe documents related to the Colored Conventions.
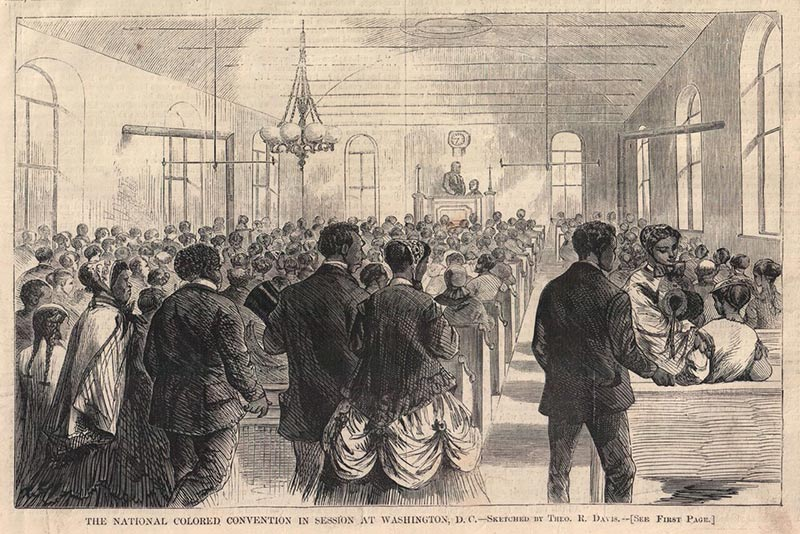
The Colored Conventions were events that took place during the nineteenth century and spread across 34 states. In these Conventions, the participants talked about how they could get access to voting rights, education, labor, and business.
However, despite how important they were, no one really talks about the Colored Conventions today. It is incredibly sad for me to see this important part of our history being neglected.
Another interesting aspect about the Colored Conventions that I learned about through interviewing the team is that the documents related to the Conventions were very male dominated. What this means is that while men’s efforts were well documented in the Conventions’ archive, women’s efforts were not. For example, of the names initially identified and highlighted in the documents, 98% belong to men.
An early researcher who recognized women’s contributions to the Colored Conventions is Dr. Psyche William Foresham, a University of Maryland professor who wrote the essay “What Did They Eat? Where Did They Stay?” In the essay she talked about how women organized restaurants and boarding houses for the people who traveled from other states to join the Convention meeting. They also financially supported them. The essay was eye opening for other researchers, and prompted them to read the Conventions’ documents more carefully to find references to women that might have been overlooked. As a result of these efforts, they found more references to women in the Convention documents.
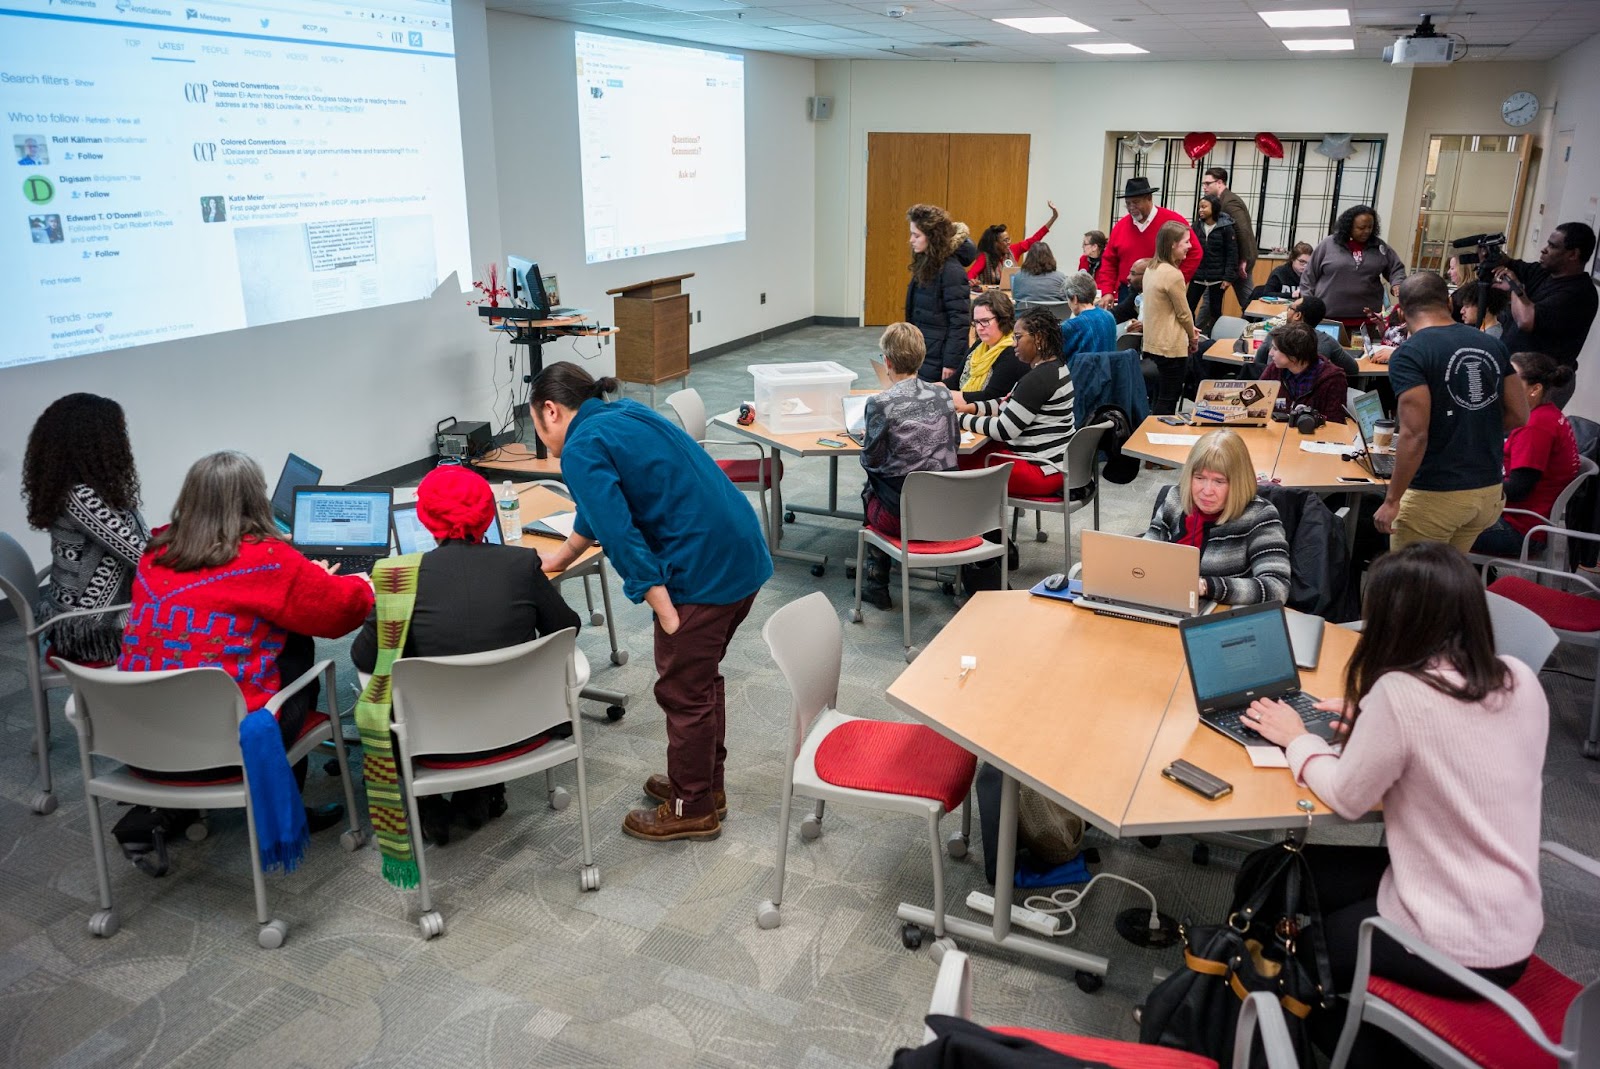
Zooniverse volunteers also helped transcribe the Colored Convention documents, further unlocking the data for the researchers. The researchers were thrilled to see so many people actually participating in transcribing the documents and caring deeply about the project. The volunteers transcription efforts also uncovered additional evidence of references to women’s efforts in the Colored Convention documents. In my own journey learning about this project, I was happily surprised to see that so many people participated in transcribing the documents and cared about this piece of history that was neglected for so long.
Here are some clips from the full recording of my interview with Dr. Jim Casey and Justin Smith.
A few final thoughts: When I was interviewing the researchers, I loved seeing how passionate they were. It feels rare to talk with people who are passionate about their work. If I see someone who is really passionate about their work and the effort they put in, it’s incredibly motivating. I hope to feel the same in my career.
Colored Convention Project team helping the volunteers during the Transcribe-a-Thon. Credit: Dr. Jim Casey
During my interview, I was nervous in the beginning because this was my first time interviewing a researcher, or anyone. My hands and feet were cold. I tried to calm myself down so I wouldn’t stutter. I think I did a good job interviewing them. My mentor, Sean (who is the Zooniverse designer at Adler), helped me a lot in preparing for the interview. He helped me see that the pressure is not on me as an interviewer; instead, the pressure is on the interviewees because they need to answer the questions. I think that really helped me to calm down because I kept saying to myself that “the pressure is on them, not me.” And my interviewees were such nice people too! I was proud of myself for how I carried out the interview.
Last, but not least, thank you to my teammates Dylan and Lola Fash for helping me out with my summary, video editing, and my blog.
These are my Zooniverse intern colleagues. They helped me with every single challenge in my internship. Photo credit: Tasnova]
By Dylan, Guest Writer and Adler Zooniverse Summer ’22 Teen Intern
Every once in a while, you get an opportunity that’s so cool, you sort of can’t believe that it’s happening. When I was told that I would have the chance to interview Dr. Colin Orion Chandler, a (then) grad student at Northern Arizona University, who is responsible for creating and leading the Active Asteroids project on Zooniverse, I was beyond thrilled. Every year, the Adler Planetarium in Chicago hires several interns to fill a variety of placements around the museum. As Zooniverse interns, Lola Fash, Tasnova, and I got to interview several researchers on three different projects: Transcribe Colored Conventions, NASA GLOBE Cloud Gaze, and my focus, Active Asteroids.
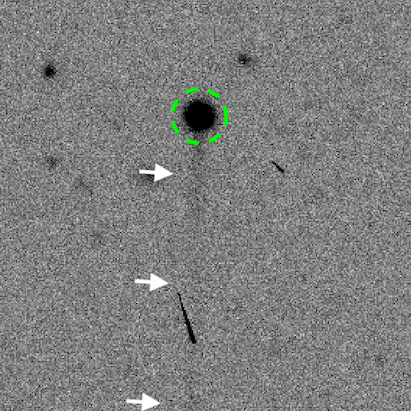
What are active asteroids, and why should we care?
An active asteroid pictured on the Active Asteroids project About page, on the Zooniverse website. The green circle shows where a coma would appear, and the white arrows point to the tail of the asteroid. (Photo Credit: Zooniverse)
Active asteroids are bodies that follow a typical orbit for an asteroid, but, when observed, they are seen to have comae, which are clouds around the object, and tails, which form when water, dry ice, or dust streak out behind the object. These bizarre objects are extremely rare, so we don’t know much about them, but their tails and comae lead researchers to believe that they might have water on them. According to Dr. Chandler, “Water gives us fuel power. Things that we need to drink, to live, gives us things to breathe. It lets us grow food. I mean, it does a huge number of things. But you have to actually know where you might find it and how hard it is to get out of there.”
The hunt for active asteroids
Studying active asteroids could yield remarkable amounts of scientific information, but they are so faint that scientists have trouble finding them. However, the Dark Energy Camera in Chile is sensitive enough to photograph these asteroids, and it sometimes catches an asteroid in part of an image when it was photographing a different object altogether.
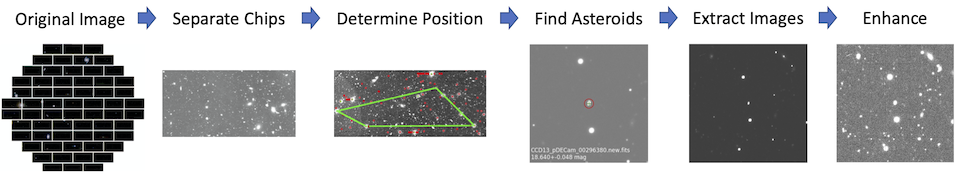
To get data from these archived images, Dr. Chandler and his team break the images into chips, cut out the asteroid, and then focus and enhance the image so that, if there is a tail, we will be able to see it. Will Burris, one of Dr. Chandler’s students, has helped streamline this process. All of these steps have been automated so that computers can process the nearly 30 million images that could contain active objects, and narrow it down to about 10 million where the objects are most likely to appear.
The image above demonstrates the process by which the Active Asteroids team finds images of potential active asteroids before they pass the images along to volunteers who can better identify them. (Photo Credit: Zooniverse)
The next step in the process is to identify whether or not there is a tail or coma around the object in the image, and that’s where volunteers come in. Computers are unable to identify active asteroids with a reasonable degree of accuracy, so the task falls to human minds. But, because of the sheer volume of images, Dr. Chandler and his team are unable to process them on their own. Instead, they harness the power of the crowd to classify these images for them, so they can process the data in a reasonable amount of time. When we spoke, Dr. Chandler explained why he opted to go this route, and why he chose to use Zooniverse specifically, stating that, without Zooniverse “It [Active Asteroids] wouldn’t have been as successful, not even by a fraction.”
Once Zooniverse volunteers have fully sorted the data, Dr. Chandler and his team examine the results and single out promising candidates that should be followed up on later with different telescopes. William Oldroyd, in particular, helps with this process. One improvement he’s looking to make is discarding feedback from overly optimistic citizens. Some citizens flag far more asteroids as active than what truly exists, which can throw off the data collected by the Active Asteroids team. The observation and analysis team hopes that they will be able to separate these overly optimistic classifications from the rest, so that they can improve the accuracy of the data that comes in.
With a complete dataset, Dr. Chandler as well as his project co-founder, Jay Kueny, and their chief science advisor, Chad Trujillo, examine the results. If an object was flagged as active, they follow up in one of two ways; direct observation and archival research.
Studying active asteroids
Pointing a telescope directly at a candidate active asteroid to look for more signs of activity seems like the most obvious way to confirm whether or not it is active. However, this is often difficult for several reasons.
For one, many candidates are so faint that it can be difficult for even the most advanced telescopes, such as the James Webb Space Telescope, to pick them up.
For another, they can only be observed at certain times in their orbits, and those intervals are usually years apart. Even if an asteroid is visible, it might not be active at that time, since there are many different reasons that an asteroid becomes active, and they each result in different patterns in activity. In an impact event, activity is temporary and only associated with the collision. Likewise, in the event of a rotational breakup, which occurs when an asteroid spins too quickly and falls apart as a result, an asteroid will only have activity corresponding with breakup events.
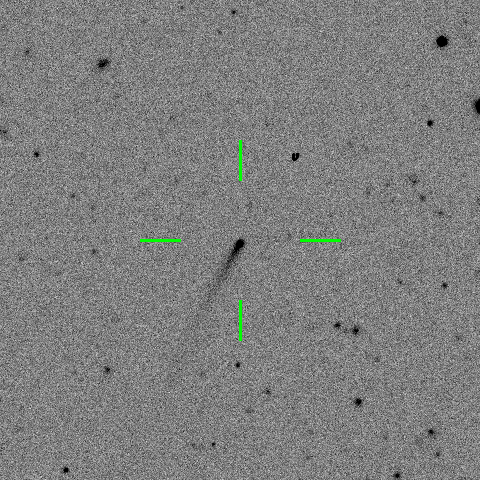
The image is one that volunteers classified on Active Asteroids. This object has already been confirmed as active. However, if one were to look at it with a telescope right now, it might not currently have a tail, or it might not be visible at all. (Image Credit: Zooniverse)
The asteroids that are most likely to show repeated activity are asteroids that are active due to sublimation, a process in which, as the asteroid gets closer to the Sun, the frozen carbon dioxide and water on its surface turn into gas and form a coma and tail behind it. Although this is a recurring event, a formerly active asteroid will not always be sublimating, so even if it can be observed, activity might not be detected.
For all of these reasons, when an object is identified as a promising candidate for activity, researchers prefer to follow up by looking through archived images that contain that object. When we talked, Dr. Chandler referred to “archival investigations” as “instant gratification” since he did not have to deal with the limitations of direct observation, and he could immediately confirm activity and further investigate the object by using images that were already taken.
Dr. Chandler and his team have already used the results from Active Asteroids to find and study several promising objects, and they are in the process of publishing their findings.
Reflections on my experience
All in all, working as a Zooniverse intern and learning about Active Asteroids has been an amazing experience. Going into the interview, I was worried that Dr. Chandler would be unapproachable and difficult to talk to. However, he seemed more than happy to discuss his work with me, and we actually talked well beyond the time when I’d originally expected the interview to stop. We were able to talk not just about Active Asteroids, but also what it’s like to be an LGBTQ+ person pursuing a career in science. As a young trans person, I often feel like I lack a connection with adults in my community, so getting to talk to someone with an identity similar to mine who was successfully pursuing a career in the field I aspire to join was an incredibly powerful experience. I wish I had a larger word count and some more time since I feel like I could probably write a whole book on interning at the Adler Planetarium and studying the Active Asteroids project on Zooniverse.
When I originally heard about active asteroids, I was mildly intrigued, but not all that excited about writing about them. Although I love all things space related, six months ago I would have said that asteroids are just about the most boring thing in space. However, after having done this project, I’ve become enthralled by active asteroids, and small planetary bodies in general. The idea of all the smaller rocks, tumbling through strange orbits in all kinds of places around the Sun, some with water or other invaluable resources that we may never even find, has found a special place in my heart. I hope this blog post has given you a piece of that.
In our Who’s who in the Zoo blog series we introduce you to some of the people behind the Zooniverse.
In this edition, meet Dr Liz Dowthwaite, who is a Senior Research Fellow at the University of Nottingham, and long-term Zooniverse research collaborator
– Helen
Name: Liz Dowthwaite
Location: University of Nottingham, UK
Tell us about your role within the team
I have been working with the Zooniverse off and on for about 3 years. I don’t have an official Zooniverse job title, I am a Senior Research Fellow in Trustworthy Autonomous Systems (https://www.tas.ac.uk) and Horizon Digital Economy Research (https://www.horizon.ac.uk/) at Nottingham, and am lucky enough to be able to spend some of that time working with the Zoo team. However, I have been called the ‘tame psychologist’! My work with the Zooniverse focuses on understanding how volunteer experiences can be enhanced to encourage continued participation and benefit the volunteer.
What did you do in your life before the Zooniverse?
Before working with the Zooniverse I was doing the same things I do now! I did BSc Psychology and an MA in The Body and Representation at the University of Reading, UK. I also worked in the academic library there for 7 years as a library assistant receiving all the shiny new books. I did my PhD in Digital and Creative Economy at Nottingham, in the Horizon CDT, studing online webcomic communities. I started as a Research Assistant in Horizon in 2016 whilst writing up my PhD, moving on to Research Fellow when I graduated in 2018, and recently won a promotion to Senior Research Fellow.
What does your typical working day involve?
I am a research psychologist based in a computer science department, so I study how people interact with technology. I mostly work from home in a tiny village in Oxfordshire, being frequently interrupted by two cats who would swear they have never been fed in their lives. I travel up to Nottingham about once a month to see my PhD students, and also to teach postgrads about digital footprints, responsible research and innovation (RRI) and experimental design. In my day-to-day I work across a range of multidisciplinary projects, for example online moderation and end-to-end encryption, trust in technology among people with mental health difficulties, benchmarks for measuring trust, and online wellbeing. This involves a lot of online meetings with my colleagues around the country, and lots of time spent reading things on the internet! Some of this is managing and planning the projects, some is conducting research – I write and analyse a lot of questionnaires!
How would you describe the Zooniverse in one sentence?
The Zooniverse is a force for good in the online world, allowing anyone anywhere to make a real difference.
Tell us about the first Zooniverse project you were involved with
I tend to study the Zooniverse as a whole but I last year I worked with some of the team at Science Scribbler: Placenta Profiles to help them to understand more about their volunteers.
Of all the discoveries made possible by the Zooniverse, which for you has been the most notable?
I found a Supernova! Does that count?!
What’s been your most memorable Zooniverse experience?
When we run surveys with volunteers we often get some really lovely stories about what the Zooniverse really means to people, and I think that’s really wonderful. Our projects have connected people to their own histories and cultures, and made impacts on their current lives, which is really heartwarming and I love reading them.
What are your top three citizen science projects?
I don’t really have a favourite, I like to play with a range of projects. I tend to enjoy images and graphs the most. I was completely addicted to the original Muon Hunters, I saved all the images that looked like smiley faces, and it was really simple and quick and had a real ‘just one more’ vibe. I also love the University of Wyoming Raccoon Project because who doesn’t love trash pandas?
What advice would you give to a researcher considering creating a Zooniverse project?
Think about how you can support and engage with your volunteers beyond just asking them to take part in the project!
How can someone who’s never contributed to a citizen science project get started?
Just get clicking! There really is something to interest everyone on the Zooniverse – explore the project pages and dive in. Most of the projects have excellent tutorials to get you started. Remember that it’s ok to get things wrong, many people classifying the same things leads to an excellent consensus and high quality data. And if a project isn’t for you, there is bound to be another one out there that you’ll love.
When not at work, where are we most likely to find you?
On the internet! But also reading the London Review of Books, drinking wine, or walking in the beautiful countryside around Oxfordshire – sometimes all of those at once if we find an awesome country pub! I’m also a keen cook (but not baker) and an extremely keen eater, and a reluctant runner (partly due to all of the eating)…
By Lola Fash, Guest Writer and Adler Zooniverse Summer ’22 Teen Intern
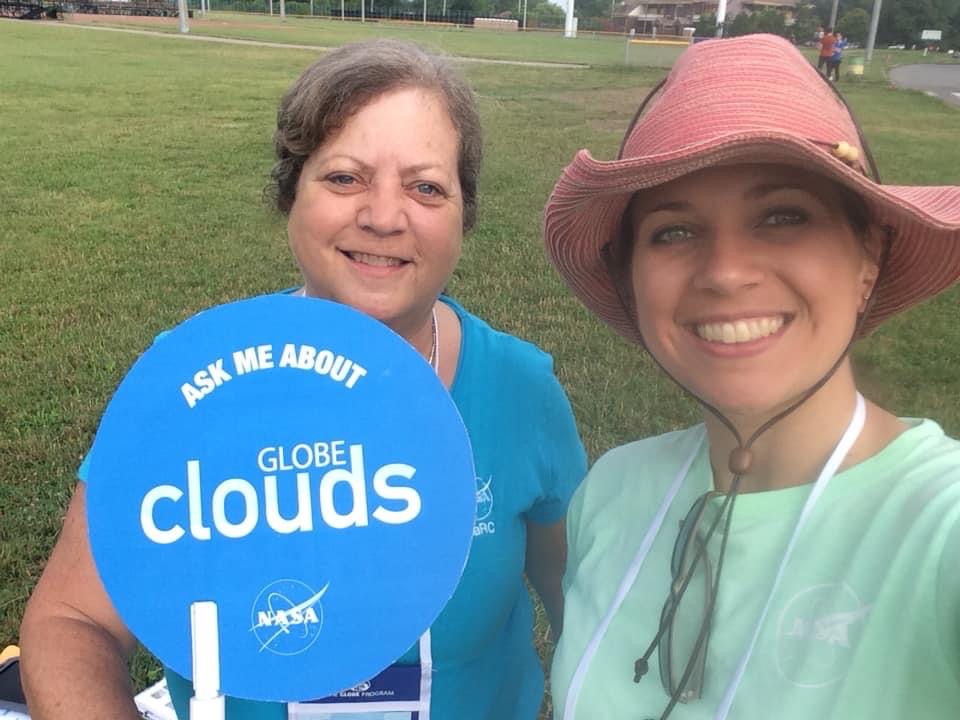
This summer I had the opportunity to be a Zooniverse intern at the Adler Planetarium in Chicago, with two other interns, Tasnova and Dylan. As a group, we carried out a series of interviews with researchers leading Zooniverse projects. My focus project was the NASA GLOBE Cloud Gaze on Zooniverse. I led the interview with NASA scientist Marilé Colón Robles, the principal investigator for the project, and Tina Rogerson, the co-investigator and data analyst for the project.
Marilé Colón Robles (right) and Tina Rogerson (left) outdoors working on GLOBE Clouds. Photo Credit: Tina Rogerson.
NASA GLOBE Cloud Gaze is a collaboration between the Global Learning and Observations to Benefit the Environment (GLOBE) Program, NASA’s largest citizen science program, and Zooniverse. When NASA began to study clouds to understand how they affect our climate, they launched about 20 satellites to collect data on Earth’s clouds. Unfortunately, these satellites are limited to only collecting data from above the clouds, which only paints half of the picture for scientists. They needed data from the ground to complete the picture. In 2018, they launched the first ever cloud challenge on GLOBE Clouds, which asked people all over the world to submit observations of clouds and photographs of their sky through the GLOBE Observer app. People responded faster than expected, submitting over 50,000 observations across 99 different countries during the month-long challenge. Because of the high volume, it would take months for researchers alone to go through each submission. So instead, they sought help, thus birthing the Zooniverse CLOUD GAZE project, where people help them classify these photos. Zooniverse participants classify the photos by cloud cover (what percent of the sky is covered by clouds), what type of cloud is in the image, and if they see any other conditions like haze, fog, or dust.
Why are clouds so important?
We see the immediate effects of these clouds in our atmosphere. For example, when you go out on a sunny day and the sun gets blocked by low altitude clouds, you feel cooler right away. But rather than looking at short-term effects, the CLOUD GAZE project is working to understand the long-term role clouds play on our climate.
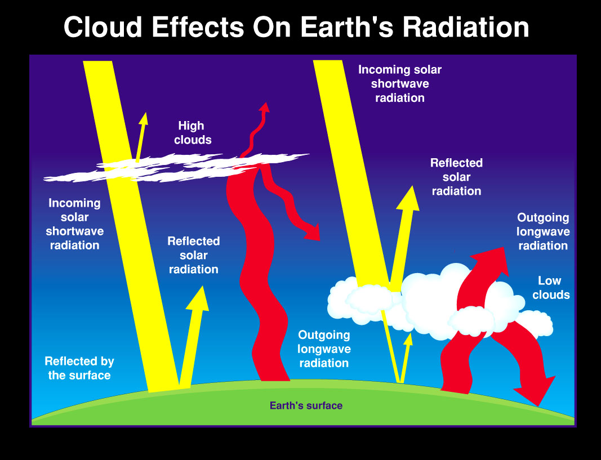
Clouds play a significant role in maintaining Earth’s climate. They control Earth’s energy budget, the balance between the energy the Earth receives from the Sun and the energy the Earth loses back into outer space, which determines Earth’s temperature. The effects clouds have varies by type, size, and altitude.
Credit: NASA GLOBE CLOUD GAZE
Cirrus, cirrostratus, and cirrocumulus clouds are high altitude clouds that allow incoming radiation to be absorbed by Earth, then trap it there, acting like an insulator and increasing Earth’s temperature. Low altitude clouds, such as stratus and cumulonimbus, keep our planet from absorbing incoming radiation, and allow it to radiate energy back into space.
The classifications made by Zooniverse participants are needed to determine the amount of solar radiation that is reflected or absorbed by clouds before reaching the surface of Earth and how that correlates to climate over time.
In my interview, I had the honor to meet with NASA Scientists Marilé Colón Robles and Tina Rogerson, learn more about the NASA GLOBE Cloud Gaze effort, and hear their predictions for the future.
Clip 1: Introductions
This first clip is of Marilé, Tina, and me introducing ourselves to one another. Note: The other participants you’ll see in the recordings are Sean Miller (Zooniverse designer and awesome mentor for us interns) and Dylan and Tasnova (my fellow interns).
Clip 2: What prompted you to start NASA GLOBE Cloud Gaze on Zooniverse?
Quote from Tina from this Clip 2: “We have 1.8 million photographs of the sky. We want to know what’s in those photographs.”
Clip 3: What have your GLOBE participants been telling you about what they’re seeing in their local environments about the impacts of climate change?
What are your hopes and goals for this project?
In the interview, I asked them about their hopes and broader goals for the project. They talked about how in order to really understand climate change, we need to gather the best data possible. The majority of the data we have on clouds are from the 20th century. One of the project goals was to update our databases on clouds in order to conduct proper research on climate change. Tina Rogerson, Cloud Gaze’s data analyst, gathers this information and compiles it into easily accessible files. The files include data from a range of different sources: satellites, Globe observations, and Zooniverse classifications (see https://observer.globe.gov/get-data). They give people a chance to analyze clouds at different points and connect the dots to analyze the whole.
Scientist Marilé Colón Robles explained that one of the goals of the project is to make a climatology of cloud types based on the data they have collected. This would help us have a record on how the clouds have changed in a given location in relation to the climate of that area. We would have information on the entire world, every single continent, yes, including Antarctica.
Why did I pick this project to focus on?
I chose this project because I wanted to challenge myself. I have always shied away from topics and conversations about climate change and global warming. I felt I could never fully comprehend it so I should instead avoid it by all means possible. My fellow interns and I had three projects to choose from: Transcribe Color Convention, Active Asteroids, and NASA GLOBE CLOUD GAZE. If it were any other day, I would have chosen one of the first two projects to be my focus but I wanted to change, to try something new. The only way to grow is to step out of your comfort zone and I am so glad I did.
People make the mistake of believing that climate change can’t be helped and that after our Earth becomes inhabitable we can just pull a Lost In Space and find a different planet to live on. I had the chance to speak with Dr. Michelle B. Larson, CEO of Adler Planetarium, and we talked about how there isn’t another planet for us to go to if we mess this one up. Even if there was, it would take years and a lot of resources to ready the planet for ourselves. Those are resources and years that we could be spending on fixing our home.
The CLOUD GAZE focused on one of the most important and understudied factors in Earth’s climate – clouds. People all over the world are helping in their own way to help save the planet. Some make sure to always recycle their garbage. Some take public transportation more often, and switch to electronic vehicles to cut down on their carbon footprint. You and I can help by taking pictures of our sky, submitting it in the GLOBE Observer app, and by going to the Zooniverse Cloud GAZE project, classifying as little as 10 images of clouds per day to multiply the data on clouds, which in turn helps further our research and our understanding of climate change.
This is a guest post by summer intern Anastasia Unitt.
Talking about the weather is a national pastime in England. When I meet Dr. Ramana Sankar on a sunny day in Oxford, we find ourselves discussing dramatic clouds and ferocious storms – in stark contrast to the empty blue skies above us. Ramana is telling me about the turbulent meteorology of our solar system’s fifth planet: Jupiter.
Jupiter is a gas giant. Its atmosphere is made of very different stuff to ours, predominantly hydrogen and helium, but it does have clouds of water vapour like we do, as well a variety of storms and hurricanes. These vortices are governed by the same physics as Earth’s own, just on a much larger scale; Jupiter’s most famous storm, the Great Red Spot, is twice the width of Earth and has raged for over 300 years. Wind speeds on the planet can approach 900 miles per hour at its poles, encouraged by jet streams formed by the planet’s 10 hour long rotations – the fastest in our solar system. For those interested in meteorology, it’s a fascinating place to study.
Ramana tells me that to research Jupiter’s weather he works with a very important colleague: Juno, a space probe launched in 2011. Five years later in 2016 it reached Jupiter. Ever since, it has been sending back data, including images which show a diverse array of weather formations, varied in form, swirling, morphing, spinning. I’m surprised by how many different colours appear in these clouds, not only orange as I expected, but also shades of blue and grey. The enormous variety of features in the images provide an opportunity to learn more about how storms work on Jupiter, and Ramana explains that to do this they need to collect observations of the weather captured in Juno’s images. There are thousands of these pictures, so he has enlisted citizen scientists on Zooniverse to look through them and annotate features. They mark storms, clouds, and anything else they notice, building a catalogue of formations. With their help Ramana can spot repeating patterns, as well as explore unusual or rare vortices.
Swirling Jovian storms, in images captured by NASA’s Juno space probe.
I find myself wondering what causes this dramatic Jovian weather, and according to Ramana astronomers are curious about this too. To answer this question, he says we need to go back to how the planet was made: “long ago, the sun formed and around it was this disc of gas and dust, which contracted to form different planets.” This compression generated enormous amounts of heat; even now, the temperature at Jupiter’s core is thought to be about 24,000°C, maintained by high internal pressure due to its immense size. As Ramana puts it: “Imagine a boiling kettle. Bubbles are coming up due to the stove heating the bottom of the pan. The storms on Jupiter are these bubbles, but rather than forming over two minutes, they form over 5-10 years.” This is in contrast to Earth, where storms form due to heat from the sun. I ask Ramana what this internally-originating heat means for his study of Jupiter’s weather, and he explains that this is something he is exploring. “The question comes down to: why are these storms distributed at specific locations, why is the heat preferentially pointed one way versus the other? Getting the catalogue of vortices and seeing where they’re forming can help us.”
With this aim in mind, citizen scientists have classified over 35,000 photographs of Jupiter’s stormy surface. When I ask Ramana what their best finding has been so far, he pauses for a moment before he responds, clearly spoilt for choice amongst the many complex vortices they have observed. He eventually lands on one particular feature: “One of my favorite types of vortex is called a brown barge, and that’s because you’d imagine vortices are generally circular, but a brown barge is very elongated. Imagine a brown cucumber, that’s essentially what it is.” Ramana explains that precisely what causes this brown colouration is a mystery. It could be chemicals present in the clouds themselves, or haze particles in the upper layers of the atmosphere reacting with sunlight. However, the citizen scientists have made an interesting discovery about these formations: “Volunteers are finding barges which are not brown. So for all this time I thought that brown barges are brown, but it turns out there are more complications. Investigating these not-so-brown barges is a new avenue for research.”
Not-so-brown barges. On the left is an image of a typical brown barge. On the right are examples of barge-like vortices without the typical brown colouration.
When not enthusing about Jupiter’s (mostly) brown cucumber-shaped storms, Ramana is quick to point to his citizen scientists as one of his favourite parts of the project. They’ve gone above and beyond their role as storm counters; some have even been digging into additional data, outside of what Ramana has provided. “A lot of volunteers kind of go into the depths. They’re pulling in all of this data from everywhere else, like news websites, even mission reports, things like that. [The] volunteers go out of their way to explore the data by themselves.”
It sounds to me like the citizen scientists have been understandably bewitched by Jupiter’s diverse and spiraling cloud formations. On the Zooniverse talk boards I can see them excitedly discussing all kinds of interesting storms and features that they have discovered. Now they have built Ramana’s catalogue of storms, I enquire what his plans are for the next steps. “The idea is to create a subset of interesting features (like the not-so-brown barges), and then either use some sort of numerical weather modelling code to study how these features formed, or we could get context images to all of these features: look one rotation before, one rotation after. How did the feature morph between those 15 hours?” He’s excited about the findings – the volume of data the citizen scientists have analysed means there’s plenty to explore going forward.
It’s fascinating to hear how much these volunteers have contributed to our understanding of the weather on a planet 365 million miles away from our own. For a while Ramana and I discuss the motivations of citizen scientists. Is it a desire to learn, an attraction to science, or simply a way to pass the time? Ramana says from his experience it’s a mixture of the three. “The bottom line that I personally have heard about from people who have done Zooniverse projects is that they just want to spend five minutes of their time doing something else that’s not for their daily lives. Log in, classify a few things, get back to work.” Unfortunately it’s also time for Ramana and I to get back to work, so we part ways. However, as I’m walking under England’s blue and (currently) cloudless sky, I find I’m carrying thoughts of Jupiter’s distant swirling storms along with me.
Guest post from Zooniverse participant Gracie Ermi:
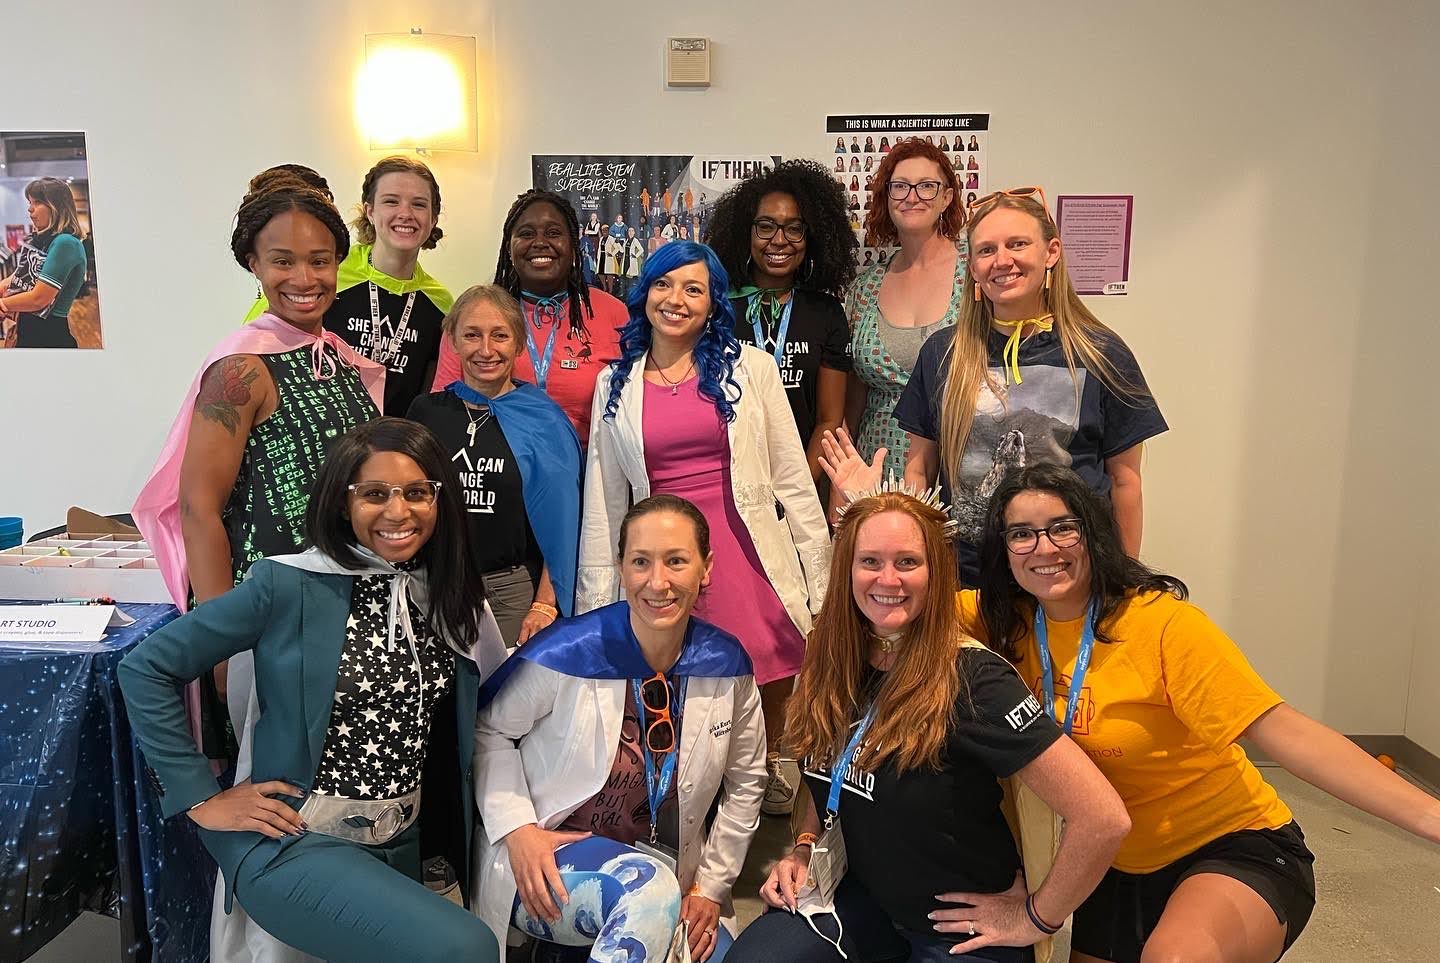
San Diego Comic-Con brings together some of the biggest fans of the most popular shows, games, comics, and films. Science is a huge source of inspiration for a lot of pop culture, so myself and 14 other scientists from around the country decided that Comic-Con would be a great venue to showcase ways that science is making a difference in the world and how it relates to our favorite media. All 15 of us are national STEM ambassadors for the IF/THEN Initiative – a program focused on increasing access to diverse STEM professionals for students, especially young girls. In addition to putting on panels about the intersection of science and pop culture, we hosted a STEAM Fair (STEAM = Science, Technology, Engineering, Arts and Math) that families in the area could attend even if they didn’t have Comic-Con tickets. At the STEAM Fair, each scientist demonstrated something from their specific field with a fun activity.
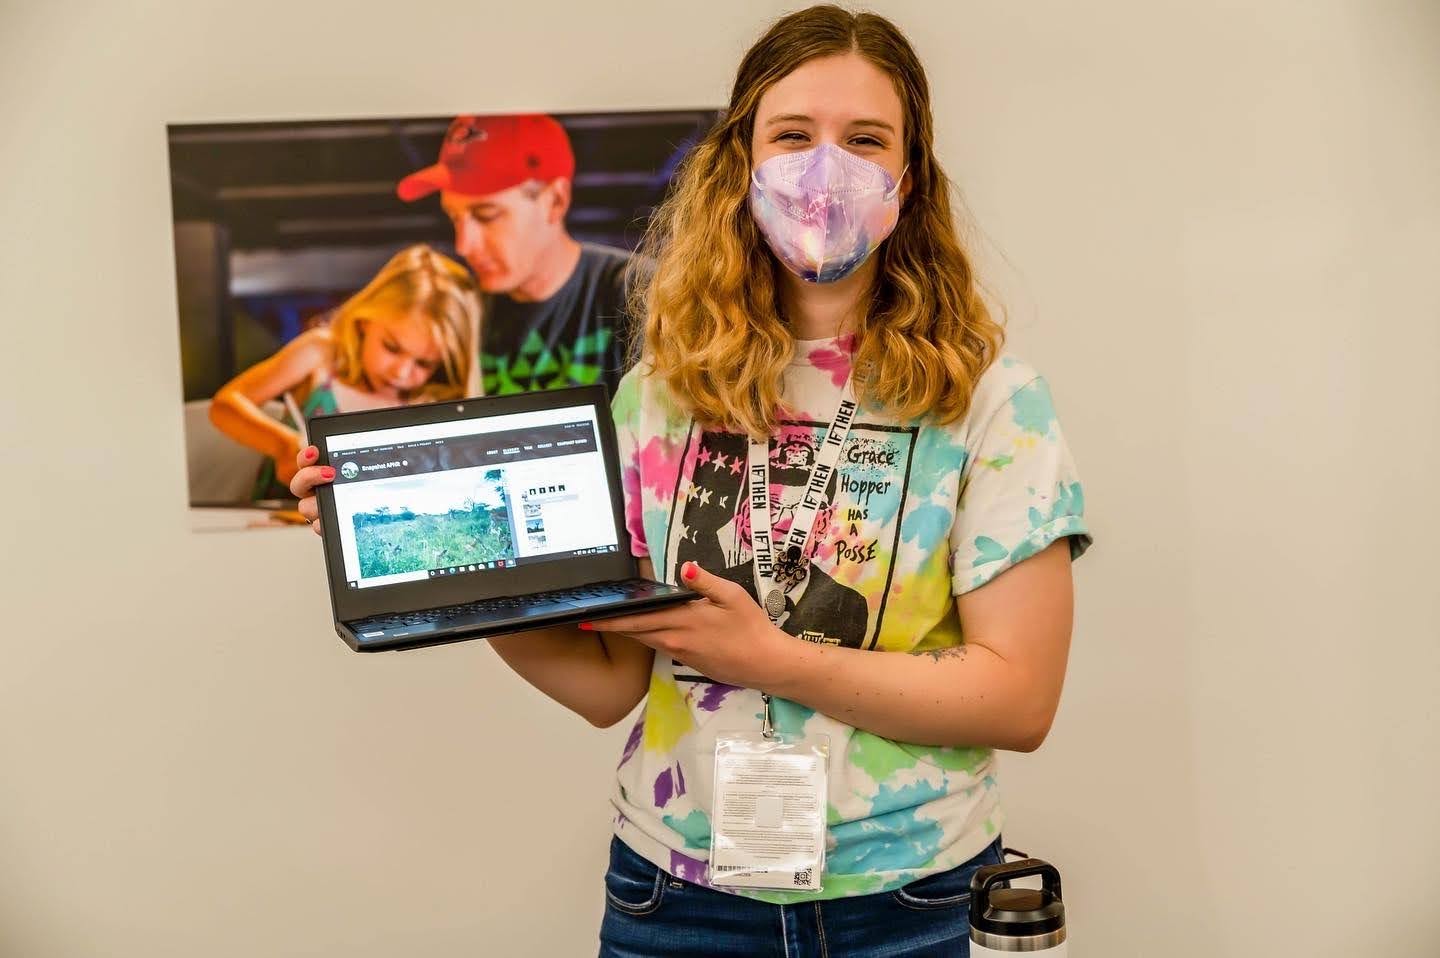
As a computer scientist who has worked on many wildlife conservation technology projects where data collection and annotation can be a big challenge, I am a huge fan of Zooniverse and the incredible generosity and human-power of this community. I thought, wouldn’t it be cool if kids who came through the STEAM fair could contribute to a real, active science project? Zooniverse was the perfect tool to use to demonstrate the types of projects I work on and to show kids that they can make a difference right now in wildlife research. I had kids identify animal species in images from the Snapshot APNR project – they loved it! Families were super excited to learn about Zooniverse (I handed out stickers so that they could remember the website if they wanted to keep exploring it at home), and some kids spent quite a while at my table, meticulously narrowing in on the species they were identifying. Everyone seemed to really enjoy getting to help out the Snapshot APNR project, and in the end around 2000 people came through the STEAM Fair over the course of 4 days. It was a huge success!
IF/THEN Ambassadors at the Comic-Con STEAM Fair. Learn more about the team at ifthensteamsquad.org!
Gracie Ermi facilitating a Zooniverse data labeling activity at the IF/THEN Comic-Con STEAM Fair
The world's largest and most popular platform for people-powered research. This research is made possible by volunteers—millions of people around the world who come together to assist professional researchers.