We recently fixed a security vulnerability in the way project titles are handled on project home pages. Prior to this it was possible to create a project which included Javascript in its name, and thus inject code into the page. After investigating this incident, we have determined that this vulnerability has not been exploited for any malicious purpose; no data was leaked and no users were exposed to injected code.
This vulnerability was reported to us on June 20, 2018, by Lacroute Serge. We began testing fixes around three hours later, which were deployed about 15 hours after the original report, on June 21, 2018.
The fixes for this vulnerability are contained in pull requests #4710 and #4711 for the Panoptes Front End project on GitHub. Anyone running their own hosted copy of this should pull these changes as soon as possible.
We have investigated the cause and assessed the impact of this vulnerability. A summary of what we found follows:
No data was leaked as a result of this vulnerability. The vulnerability was not exploited for any malicious purpose and there was no unauthorised access to any of our systems.
The vulnerability was introduced on September 12, 2017, in a change which was part of our work to allow projects to be translated into multiple languages.
We found three projects that contained exploits for this vulnerability (not including projects created by our own team for testing purposes): two were created before the vulnerability was introduced, so the exploit wouldn’t have worked at the time they were created (it might have worked if the projects were visited between September 12, 2017, and June 21, 2018, but no-one did so); the remaining project was created by the security researcher who reported the vulnerability.
Our audit included previous titles for projects (all changes to projects are versioned, so we were able to audit any project titles which have since been changed).
All three projects contained only benign code to display a JavaScript alert box. None of them attempted to perform any malicious actions.
No users other than the project owner and members of our development team visited any of these projects, so no other users activated any of the exploits.
We’d like to thank Lacroute Serge for reporting this vulnerability to us via the method detailed on our security page, following responsible disclosure by reporting it to us in private to give us the opportunity to fix it.
Part three in a multi-part series exploring the visual and UX changes to the Zooniverse classify interface
Coming soon!
Today we’ll be going over a couple of visual changes to familiar elements of the classify interface and new additions we’re excited to premier. These updates haven’t been implemented yet, so nothing is set in stone. Please use this survey to send me feedback about these or any of the other updates to the Zooniverse.
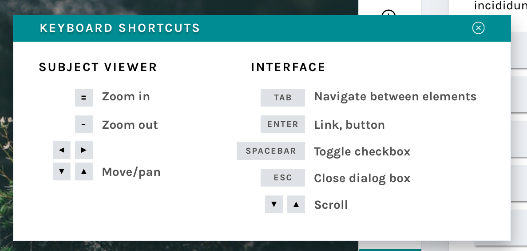
Keyboard shortcut modal
New modals
Many respondents to my 2017 design survey requested that they be able to use the keyboard to make classifications rather than having to click so many buttons. One volunteer actually called the classifier “a carpal-tunnel torturing device”. As a designer, that’s hard to hear – it’s never the goal to actively injure our volunteers.
We actually do support keyboard shortcuts! This survey helped us realize that we need to be better at sharing some of the tools our developers have built. The image above shows a newly designed Keyboard Shortcut information modal. This modal (or “popup”) is a great example of a few of the modals we’re building – you can leave it open and drag it around the interface while you work, so you’ll be able to quickly refer to it whenever you need.
This behavior will be mirrored in a few of the modals that are currently available to you:
Add to Favorites
Add to Collection / Create a New Collection
Subject Metadata
“Need Help?”
It will also be applied to a few new ones, including…
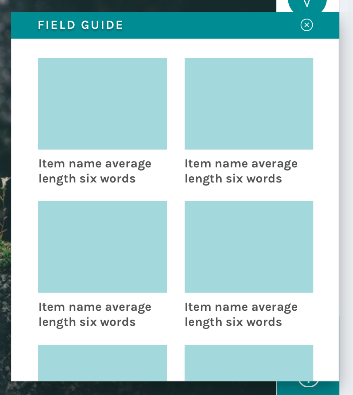
Field Guide
New field guide layout
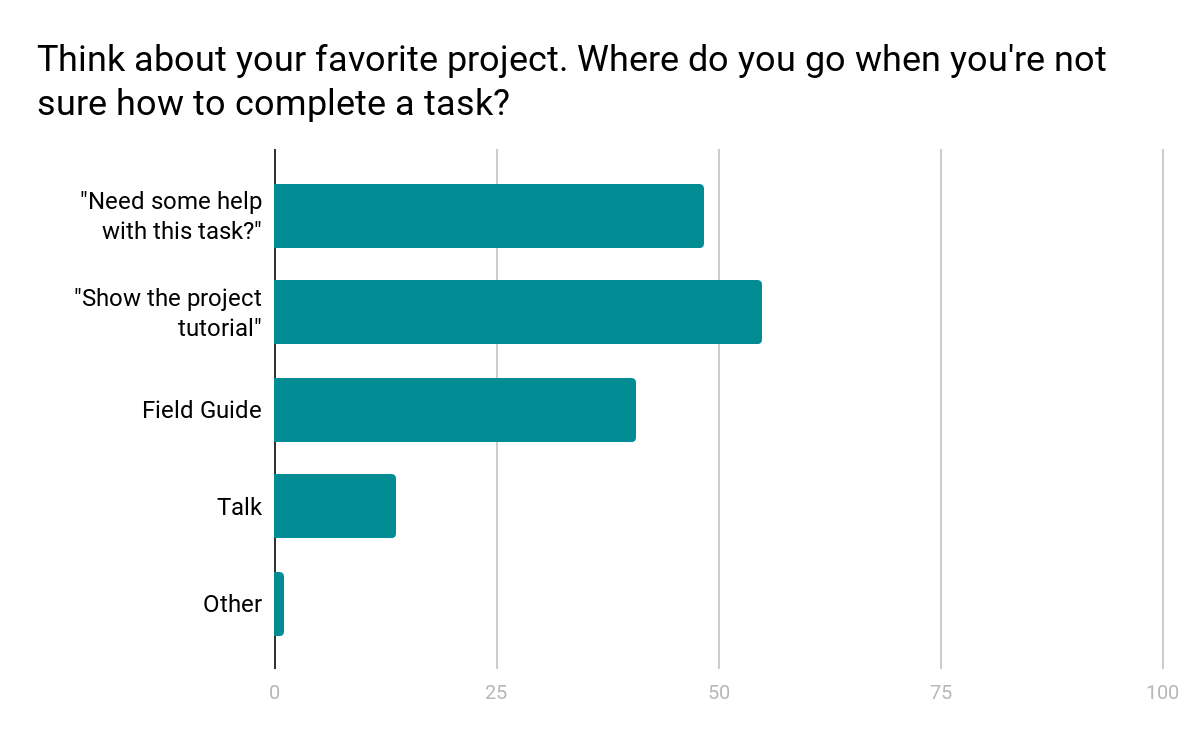
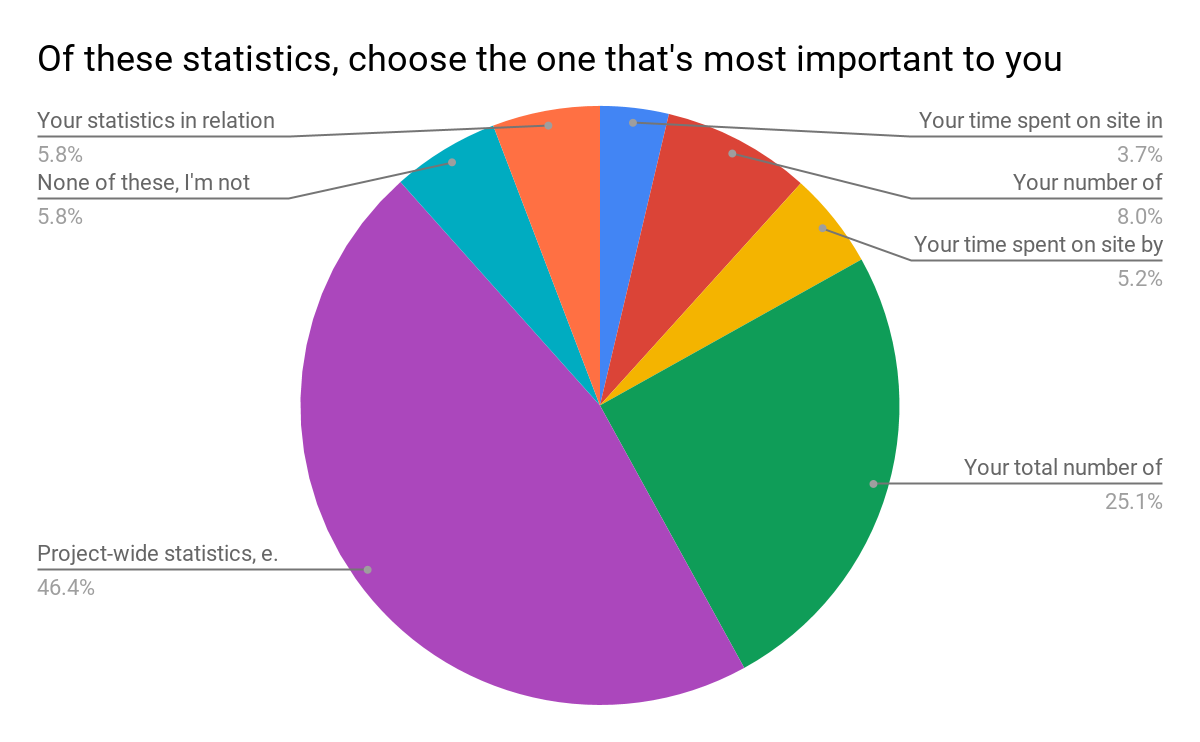
Another major finding from the design survey was that users did not have a clear idea where to go when they needed help with a task (see chart below).
Survey results show a mix of responses
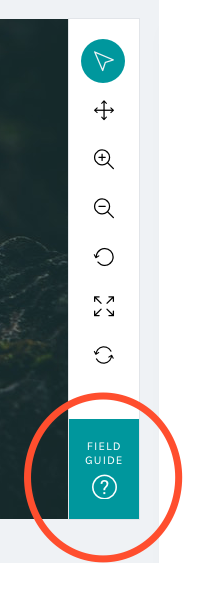
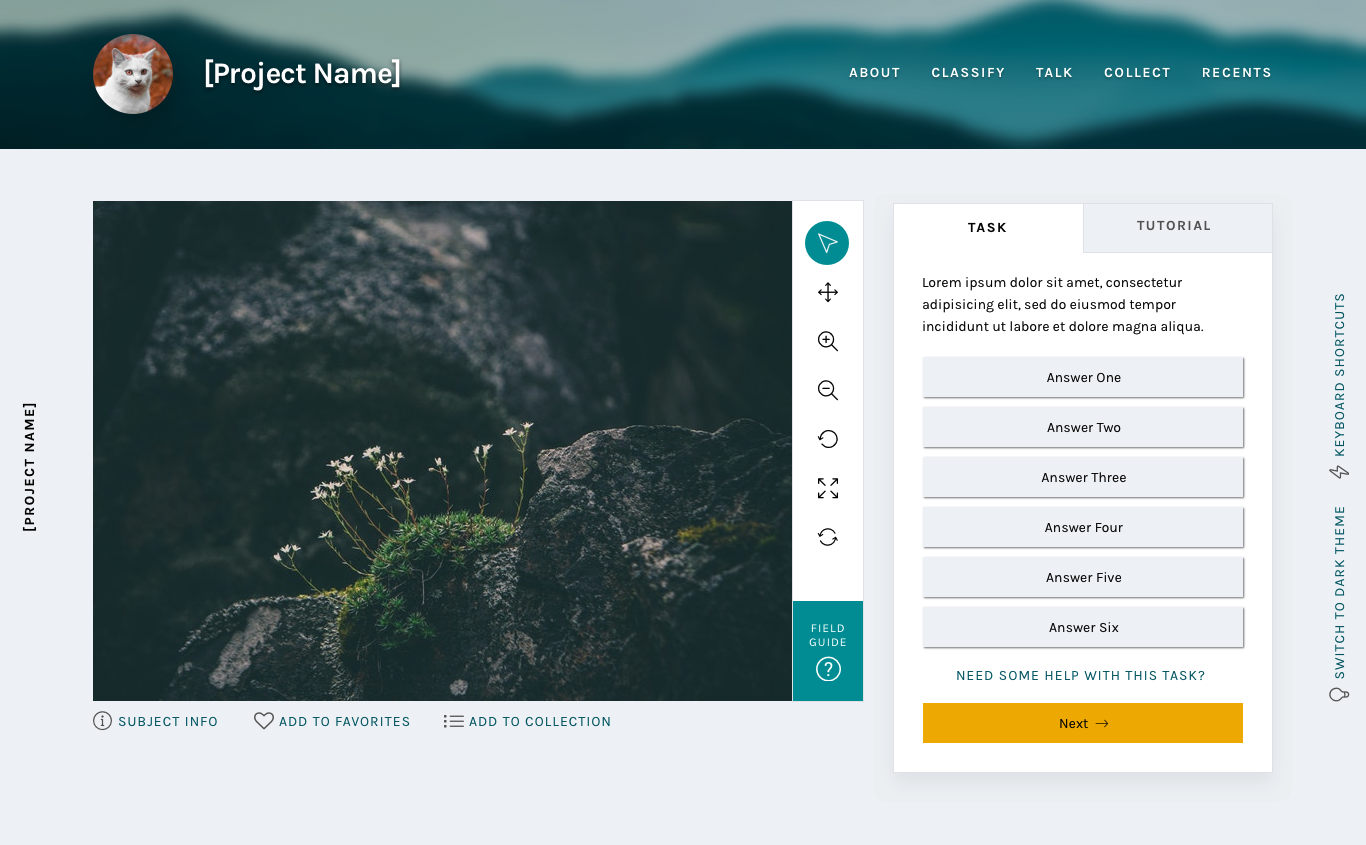
We know research teams often put a lot of effort into their help texts, and we wanted to be sure that work was reaching the largest possible audience. Hence, we moved the Field Guide from a small button on the right-hand side of the screen – a place that can become obscured by the browser’s scrollbar – and created a larger, more prominent button in the updated toolbar:
By placing the Field Guide button in a more prominent position and allowing the modal to stay open during classifications, we hope this tool will be taken advantage of more than it currently is.
The layout was the result of the audit of every live project I conducted in spring 2017:
Field Guide
Mode item count
5
Mode label word count
2
Min item count
2
Min label word count
2
Max items count
45
Max label word count
765
Using the mode gave me the basis on which to design; however, there’s quite a disparity between min and max amounts. Because of this disparity, we’ll be giving project owners with currently active projects a lot of warning before switching to the new layout, and they’ll have the option to continue to use the current Field Guide design if they’d prefer.
Tutorial
Another major resource Zooniverse offers its research teams and volunteers is the Tutorial. Often used to explain project goals, welcome new volunteers to the project, and point out what to look for in an image, the current tutorial is often a challenge because its absolute positioning on top of the subject image.
No more!
In this iteration of the classify interface, the tutorial opens once as a modal, just as it does now, and then lives in a tab in the task area where it’s much more easily accessible. You’ll be able to switch to the Tutorial tab in order to compare the example images and information with the subject image you’re looking at, rather than opening and closing the tutorial box many times.
A brand-new statistics section
Another major comment from the survey was that volunteers wanted more ways to interact with the Zooniverse. Thus, you’ll be able to scroll down to find a brand-new section! Features we’re adding will include:
Your previous classifications with Add to Favorites or Add to Collection buttons
Interesting stats, like the amount of classifications you’ve done and the amount of classifications your community have done
Links to similar projects you might be interested in
Links to the project’s blog and social media to help you feel more connected to the research team
Links to the project’s Talk boards, for a similar purpose
Possibly: A way to indicate that you’re finished for the day, giving you the option to share your experience on social media or find another project you’re interested in.
The statistics we chose were directly related to the responses from the survey:
Survey results
Respondents were able to choose more than one response; when asked to rank them in order of importance, project-wide statistics were chosen hands-down:
Project-wide statistics are the most important
We also heard that volunteers sometimes felt disconnected from research teams and the project’s accomplishments:
“In general there is too less information about the achievement of completed projects. Even simple facts could cause a bit of a success-feeling… how many pictures in this project over all have been classified? How much time did it take? How many hours were invested by all participating citizens? Were there any surprising things for the scientists? Things like that could be reported long before the task of a project is completely fullfilled.”
Research teams often spend hours engaged in dialog with volunteers on Talk, but not everyone who volunteers on Zooniverse is aware or active on Talk. Adding a module on the classify page showing recent Talk posts will bring more awareness to this amazing resource and hopefully encourage more engagement from volunteers.
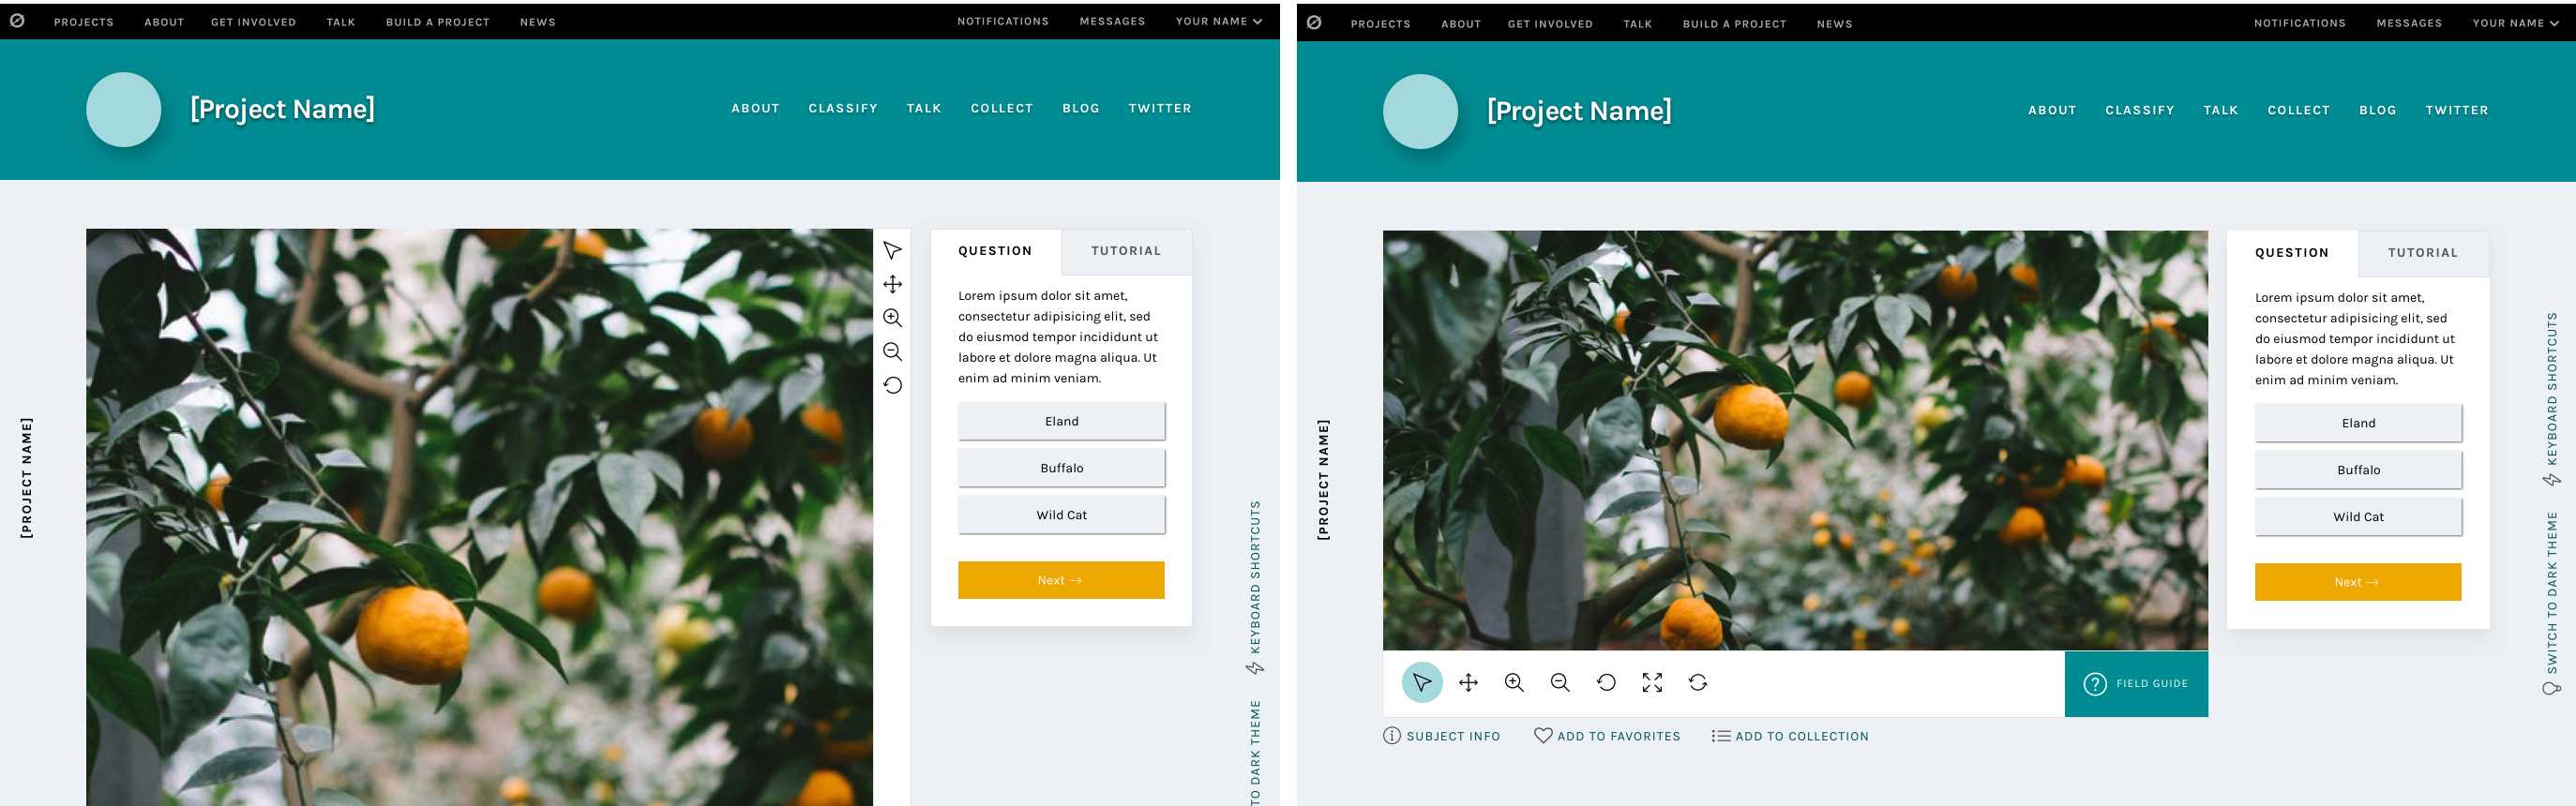
Templates for different image sizes and dimensions
When the project builder was created, we couldn’t have predicted the variety of disparate topics that would become Zooniverse projects. Originally, the subject viewer was designed for one common image size, roughly 2×3, and other sizes have since been shoehorned in to fit as well as they can.
Now, we’d like to make it easier for subjects with extreme dimensions, multimedia subjects, and multi-image subjects to fit better within the project builder. By specifically designing templates and allowing project owners to choose the one that best fits their subjects, volunteers and project owners alike will have a better experience.
Very wide subjects will see their toolbar moved to the bottom of the image rather than on the right, to give the image as much horizontal space as possible. Tall subjects will be about the same width as they have been, but the task/tutorial box will stay fixed on the screen as the image scrolls, eliminating the need to scroll up and down as often when looking at the bottom of the subject.
Wide and tall subjects
Let’s get started!
I’m so excited for the opportunity to share a preview of these changes with you. Zooniverse is a collaborative project, so if there’s anything you’d like us to address as we implement this update, please use this survey to share your thoughts and suggestions. Since we’re rolling these out in pieces, it will be much easier for us to be able to iterate, test, and make changes.
We estimate that the updates will be mostly in place by early 2019, so there’s plenty of time to make sure we’re creating the best possible experience for everyone.
Thank you so much for your patience and understanding as we move forward. In the future, we’ll be as open and transparent as possible about this process.
In this week’s edition of our Who’s who in the Zoo series meet Dr Sam Blickhan who leads the development of new Humanities projects here in the Zooniverse.
– Helen
Name: Sam Blickhan
Location: Adler Planetarium, Chicago IL, USA
Tell us about your role within the team:
I’m the IMLS Postdoctoral Fellow and Humanities Lead. I started in March of 2017 as a Postdoc, and started to take on more Humanities Lead duties in 2018.
What did you do in your life before the Zooniverse?
Before coming to the Zooniverse I was a student. I did my undergrad at the University of Iowa, studying Medieval English Literature and classical Voice Performance. Then I did a Masters in Musicology at Oxford, and went on to do a PhD in Musicology at Royal Holloway, University of London, writing about the palaeography of medieval music notation. I’ve always been interested in technologies of writing and the development of language, as well as digital approaches to research and teaching, so being able to work on transcription projects with Zooniverse is a really great way to continue that academic work in a not-so-traditional format.
What does your typical working day involve?
Always coffee. Depending on what I’m working on, my day could involve communication with research teams, project planning/design/development with my Zooniverse colleagues, grant writing, data analysis, preparing conference papers & presentations, professional development, and/or researching & writing articles. It varies quite a bit from day to day, which I love — I never, ever get bored, and I get to meet lots of interesting people!
How would you describe the Zooniverse in one sentence?
Zooniverse is as much or as little as you want it to be; a way to relax, to learn, and engage with others.
Tell us about the first Zooniverse project you were involved with
When I was in grad school I used to volunteer on Seafloor Explorer as a way to relax — I felt like I could turn off the part of my brain that was doing lots of critical thinking, while still doing something productive and interesting. The first project I was actually a part of developing was Anti-Slavery Manuscripts.
What’s been your most memorable Zooniverse experience?
I’m lucky to be able to travel regularly for my job, and I love meeting people from other platforms and/or institutions and learning about how their crowdsourcing projects work. I was part of a panel discussion at the IMLS (Institute of Museum and Library Services) in 2017, and got to meet some people who have been doing really amazing work for a long time. It was exhilarating to be able to have conversations about public research methods and access to archival materials and data, and learn from these larger communities of researchers and advocates, as well as show them what tools and opportunities for research we at Zooniverse have to offer.
What are your top three citizen science projects?
SCOTUS Notes (www.scotusnotes.org) is one of my favorite new projects. I’m a bit of a politics junkie, so reading the Justices’ comments can be a very interesting look at the thought processes behind these Supreme Court decisions. I think that the American Soldier project (https://www.zooniverse.org/projects/tkotwim/the-american-soldier) is also incredible. The soldiers’ responses to the questions are often very moving and powerful to read. Outside the Zooniverse, I’m a big fan of the Colored Conventions Project (http://coloredconventions.org/) — I was lucky enough to meet some of their team at a conference last year, and they do an incredible job of engaging their community in a positive way, and reminding the public how important it is to keep re-examining history and working to create space for those who have been overlooked. I’ve learned a lot from listening to them and watching their work.
What advice would you give to a researcher considering creating a Zooniverse project?
Look at as many other projects as you can! Really spend some time classifying, but also try to get a sense of what the volunteer and research communities are like across projects. Reach out to other project owners, as well as volunteer and Talk moderators, and ask about their experiences. It’s hard to anticipate what it will be like to run a project if you haven’t yet participated in one. Learn by doing!
When not at work, where are we most likely to find you?
Since it’s summer, I’m probably outside running, biking, or on a patio with friends. I love to make things and enjoy knitting & embroidery in particular. Music is a big part of my life, too — I go to lots of concerts and play music with friends whenever I can.
Part two in a multi-part series exploring the visual and UX changes to the Zooniverse classify interface
The breakdown
Today and in the next post, we’ll take a look at the reasoning behind specific changes to the classifier that we’ve already started to roll out over the past few months. We’ve had good discussions on Talk about many of the updates, but I wanted to reiterate those conversations here so there’s just one source of information to refer back to in the future.
In case you missed it, the first blog post in this series previews the complete new classify layout.
As a reminder, if you have feedback about these changes or anything else on the site you’d like to see addressed, please use this survey link.
Navigation bar
Updated navigation bar
We started with a rethinking of each project’s navigation bar. The new design features cleaner typography, a more prominent project title, and visual distinction from the sitewide navigation. It also includes the project’s home page background image, giving the project visual distinction while keeping the classify interface itself clean and legible. It’s also responsive: on smaller screen heights, the height of the navigation bar adjusts accordingly.
The most important goal we solved in making this change was to separate the project navigation from the site navigation. During my initial site research and in talking to colleagues and volunteers, many found it difficult to distinguish between the two navigations. Adding a background, a distinct font style, and moving the options to the right side of the page accomplishes this goal.
Neutral backgrounds
Classify interface with neutral background
In conjunction with adding the background image to the navigation bar, the background image was removed from the main classify interface. It was replaced with a cool light grey, followed quickly by the dark grey of the Dark Theme.
Legibility is one of the main goals of any web designer, and it was the focus of this update. By moving to clean greys, all of the focus is now on the subject and task. There are some really striking subject images on Zooniverse, from images of the surface of Mars to zebras in their natural habitat. We want to make sure these images are front and center rather than getting lost within the background image.
The Dark Theme was a suggestion from a Zooniverse researcher – they pointed out that some subject images are similar in tone to the light grey, so a darker theme was added to make sure contrast would be enough to make the image “pop”. We love suggestions like this! While the team strives to be familiar with every Zooniverse project, the task is sometimes beyond us, so we rely on our researchers and volunteers to point out anomalies like this. If you find something like this, you can use this survey to bring it to my attention.
Another great suggestion from a Zooniverse volunteer was the addition of the project name on the left side of the screen. This hasn’t been implemented yet, but it’s a great way to help with wayfinding if the interface is scrolled to below the navigation bar.
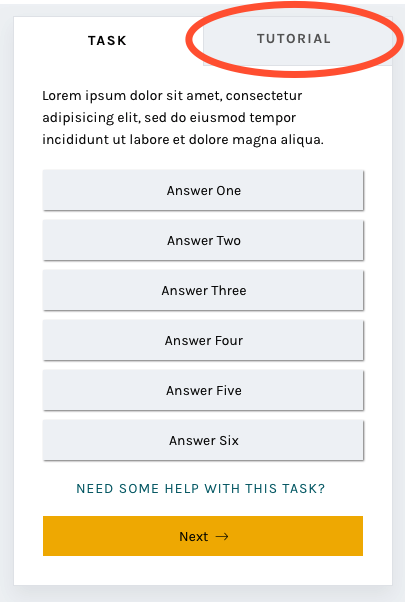
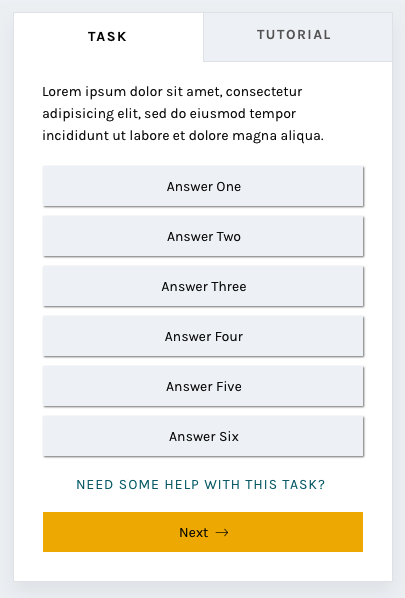
Updated task section
New task section
By enclosing the task and its responses in a box rather than leaving it floating in space, the interface gives a volunteer an obvious place to look for the task across every project. Adjusting the typography elevates the interface and helps it feel more professional.
One of the most frequent comments we heard in the 2017 survey was that the interface had far too much scrolling – either the subject image or the task area was too tall. The subject image height will be addressed at a later date, but this new task area was designed specifically with scrolling in mind.
I used the averages I found in my initial project audit and the average screen height (643 px) based on Google Analytics data from the same time period to design a task area that would comfortably fit on screen without scrolling. It’s important to note that there are always outliers in large-scale sites like Zooniverse. While using averages is the best way to design for most projects, we know we can’t provide the most optimal experience for every use case.
You’ll also notice the secondary “Tutorial” tab to the right of the “Task” label. This is a feature that’s yet to be implemented, and I’ll talk more about it in the next post.
And more to come
The next installments in this series will address the additional updates we have planned, like updated modals and a whole new stats section.
Part one in a multi-part series exploring the visual and UX changes to the Zooniverse classify interface
First, an introduction.
Zooniverse began in 2007, with a galaxy-classifying project called Galaxy Zoo. The project was wildly successful, and one of the lead researchers, Chris Lintott, saw an opportunity to help other researchers accomplish similar goals. He assembled a team of developers and set to work building custom projects just like Galaxy Zoo for researchers around the world.
And things were good.
But the team started to wonder: How can we improve the process to empower researchers to build their own Zooniverse projects, rather than relying on the team’s limited resources to build their projects for them?
In the first year of its inception, the number of projects available to citizen scientist volunteers nearly doubled. Popularity spread, the team grew, and things seemed to be going well.
That’s where I come in. * Record scratch *
Three years after the project builder’s debut, I was hired as the Zooniverse designer. With eight years’ experience in a variety of design roles from newspaper page design to user experience for mobile apps to web design, I approached the new project builder-built projects with fresh eyes, taking a hard look at what was working and what areas could be improved.
Over the next week, I’ll be breaking down my findings and observations, and talking through the design changes we’re making, shedding more light on the aims and intentions behind these changes and how they will affect your experience on the Zooniverse platform.
If you take one thing away from this series it’s that this design update, in following with the ethos of Zooniverse, is an iterative, collaborative process. These posts represent where we are now, in June 2018, but the final product, after testing and hearing your input, may be different. We’re learning as we go, and your input is hugely beneficial as we move forward.
Here’s a link to an open survey in case you’d like to share thoughts, experiences, or opinions at any point.
Let’s dive in.
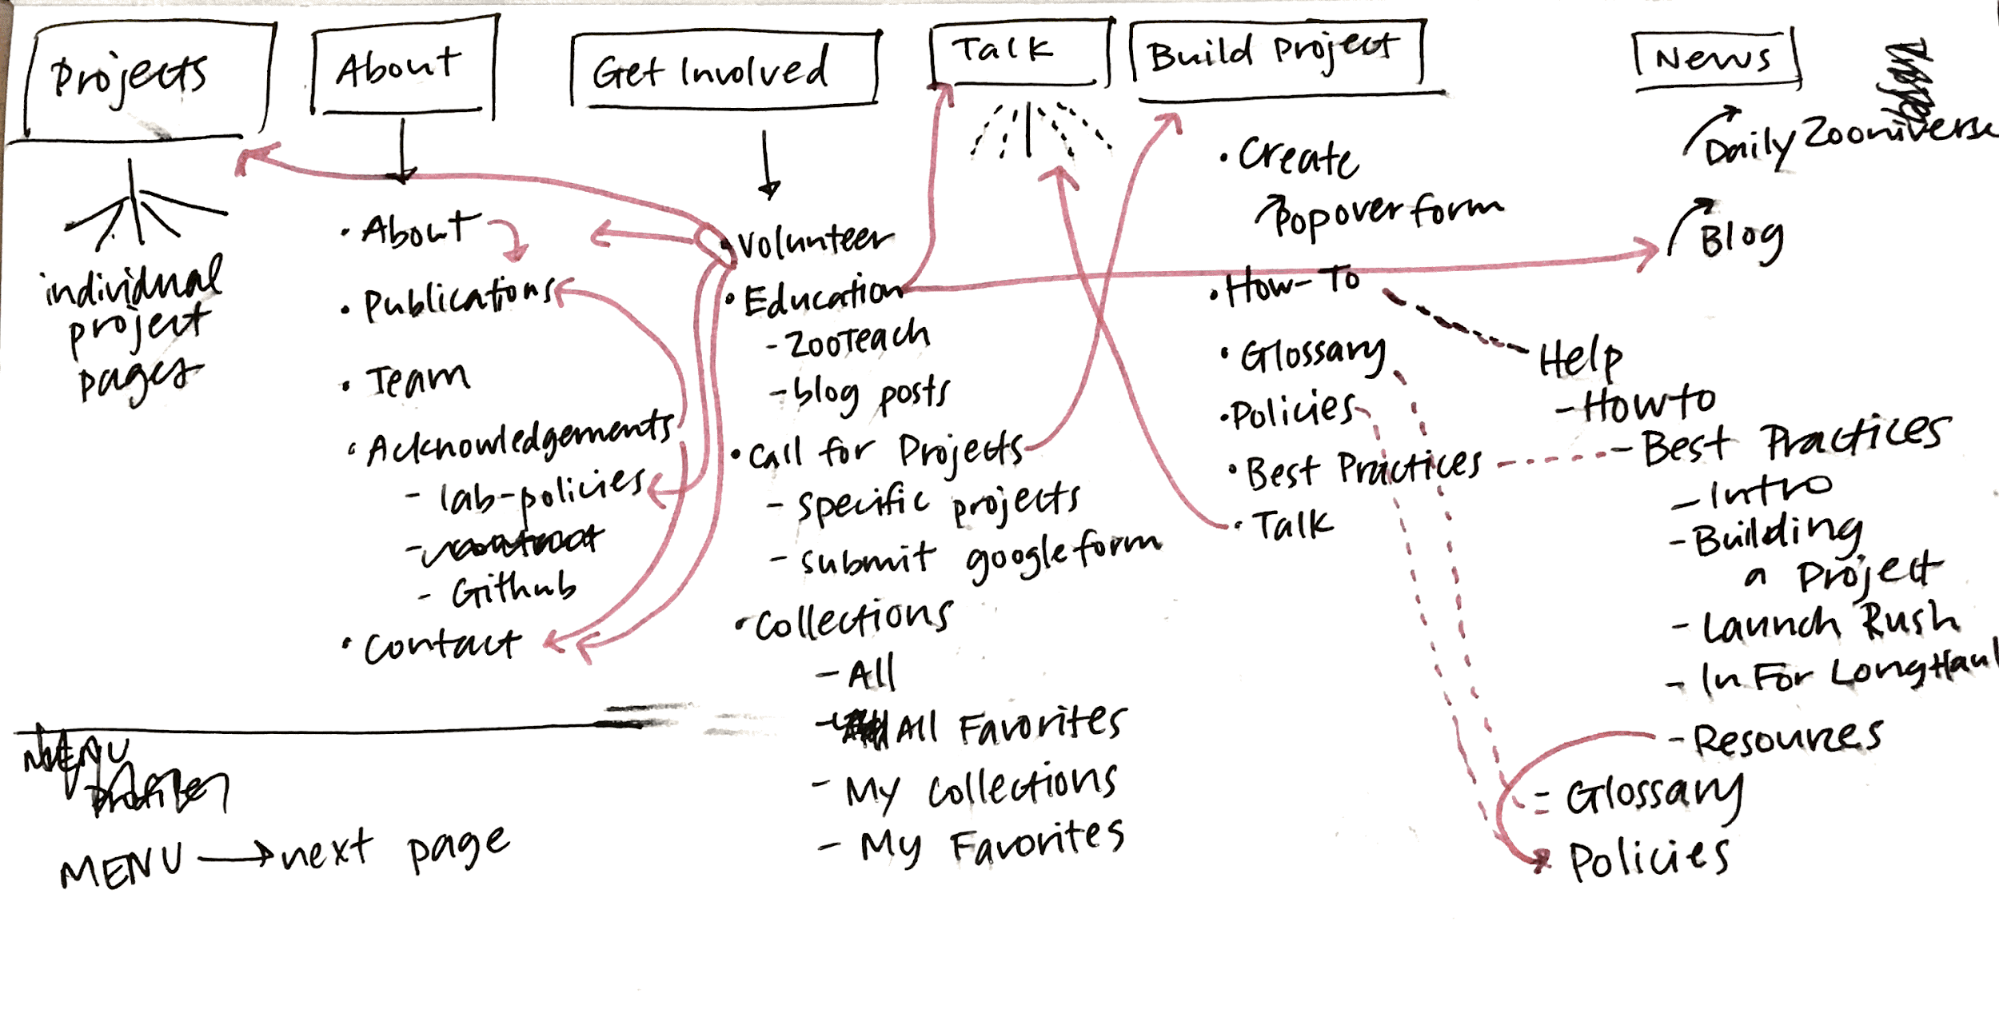
Part one: Research
My first few weeks on the job were spent exploring Zooniverse, learning about the amazing world of citizen science, and examining projects with similar task types from across the internet.
I did a large-scale analysis of the site in general, going through every page in each section and identifying areas with inconsistent visual styles or confusing user experiences.
Current site map, March 2017Analysis of current template types
After my initial site analysis, I created a list of potential pages or sections that were good candidates for a redesign. The classify interface stood out as the best place to start, so I got to work.
Visual design research
First, I identified areas of the interface that could use visual updates. My main concerns were legibility, accessibility, and varying screen sizes. With an audience reaching to the tens of thousands per week, the demographic diversity makes for an interesting design challenge.
Next, I conducted a comprehensive audit of every project that existed on the Zooniverse in March 2017 (79 in total, including custom projects like Galaxy Zoo), counting question/task word count, the max number of answers, subject image dimensions, field guide content, and a host of other data points. That way, I could accurately design for the medians rather than choosing arbitrarily. When working on this scale, it’s important to use data like these to ensure that the largest possible group is well designed for.
Here are some selected data:
Task type: Drawing
20
Answers
Average number of possible answers
2
Answer average max word count
4.5
Min number
1
Answer max max word count
10
Max number
7
Answer min max word count
2
Median number
1
Answer median max word count
1
Number with thumbnail images
1
Task type: Question
9
Answers
Average number of possible answers
6
Answer average max word count
6
Min number
2
Answer max max word count
18
Max number
9
Answer min max word count
1
Median number
3.5
Answer median max word count
4
Number with thumbnail images
3
Task type: Survey
9
Answers
Average number of possible answers
31
Answer average max word count
4
Min number
6
Answer max max word count
7
Max number
60
Answer min max word count
3
Median number
29
Answer median max word count
4
Number with thumbnail images
9
Even More Research
Next, I focused on usability. To ensure that I understood issues from as many perspectives as possible, I sent a design survey to our beta testers mailing list, comprising about 100,000 volunteers (if you’re not already on the list, you can opt in via your Zooniverse email settings). Almost 1,200 people responded, and those responses informed the decisions I made and helped prioritize areas of improvement.
Here are the major findings from that survey:
No consensus on where to go when you’re not sure how to complete a task.
Many different destinations after finishing a task.
Too much scrolling and mouse movement.
Lack of keyboard shortcuts.
Would like the ability to view previous classifications.
Translations to more languages.
Need for feedback when doing classifications.
Finding new projects that might also be interesting.
Larger images.
In the next few blog posts, I’ll be breaking down specific features of the update and showing how these survey findings help inform the creation of many of the new features.
Without further ado
Basic classify template
Some of these updates will look familiar, as we’ve already started to implement style and layout adjustments. I’ll go into more detail in subsequent posts, but at a high level, these changes seek to improve your overall experience classifying on the site no matter where you are, what browser you’re using, or what type of project you’re working on.
Visually, the site is cleaner and more professional, a reflection of Zooniverse’s standing in the citizen science community and of the real scientific research that’s being done. Studieshaveshown that good, thoughtful design influences a visitor’s perceptions of a website or product, sometimes obviously, sometimes at a subliminal level. By making thoughtful choices in the design of our site, we can seek to positively affect audience perceptions about Zooniverse, giving volunteers and researchers even more of a reason to feel proud of the projects they’re passionate about.
It’s important to note that this image is a reflection of our current thought, in June 2018, but as we continue to test and get feedback on the updates, the final design may change. One benefit to rolling updates out in pieces is the ability to quickly iterate ideas until the best solution is found.
The timeline
We estimate that the updates will be mostly in place by early 2019.
This is due in part to the size of our team. At most, there are about three people working on these updates while also maintaining our commitments to other grant-funded projects and additional internal projects. The simple truth is that we just don’t have the resources to be able to devote anyone full-time to this update.
The timeline is also influenced in a large part by the other half of this update: A complete overhaul of the infrastructure of the classifier. These changes aren’t as visible, but you’ll notice an improvement in speed and functionality that is just as important as the “facelift” portion of the update.
Stay tuned!
We’ve seen your feedback on Talk, via email, and on Github, and we’re happy to keep a dialog going about subsequent updates. To streamline everything and make sure your comments don’t get missed, please only use this survey link to post thoughts moving forward.
How do Zooniverse volunteers contribute to your research?
In general, manual quality control of brain images is very subjective and time consuming task. Zooniverse volunteers are helping us in two key ways; firstly, they are helping to validate our brain image quality control procedure, and secondly, to produce enough rated images to train computers to perform the quality control automatically.
What have been the biggest challenges in setting up your project?
Our biggest challenge was to build simple and comprehensive instructions.
What discoveries, and other outputs, has your project led to so far?
To date, with the help of Zooniverse, we have developed the first quality control procedure on brain imaging that could be performed by both novice or expert neuroscience raters. They both agree on most of the ratings. We are hoping to present this work at a conference soon (http://www.neuroinformatics2018.org/abstracts/).
Once you’ve finished collecting data, what research questions do you hope to be able to answer?
The next step will be to train machine learning model based on the information from Zooniverse raters, and to test if this model can perform as well as human rater.
What’s in store for your project in the future?
More data to rate, and other brain imaging modalities.
What are your favourite other citizen research projects and why?
I like all wildlife protection projects.
What guidance would you give to other researchers considering creating a citizen research project?
Make your tutorial clear and concise.
And finally, when not at work, where are we most likely to find you?
Hello! It’s probably about time that I introduce myself. I am the (relatively) new mobile developer working on the Zooniverse Android and iOS apps. I joined the team back in February and, as the sole developer on the project, I want to not only improve and enhance our current app, but also focus on making sure our community of project builders and volunteers are excited and engaged with the app.
So, what is the app?
As our user base on the app is significantly smaller than our user base on the website, I am guessing that a fair share of the people reading haven’t even used the app. Both the Android and iOS apps are very specialized version of the website.
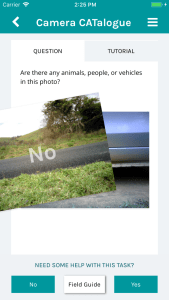
More specifically, the app only supports a specific type of workflow: A question workflow with only two answers. Here’s a screen cap from one of the current running projects: CameraCatalogue.
As the image shows, the user can swipe left or right based on the answers given below. But don’t take it from me. Give it a try!
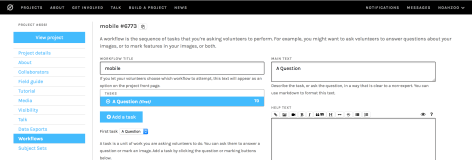
How do I get my project on mobile?
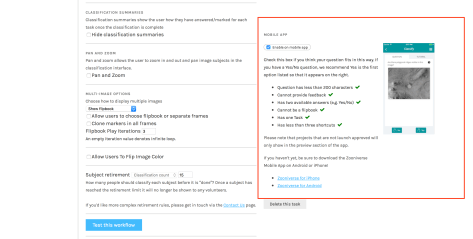
Deploying a project to mobile is not so hard. In fact, it’s just a matter of adding a mobile enabled workflow to your project. As mentioned before, the mobile app only shows question workflows, so you are going to want to configure a workflow with just a question task:
Now that you have a question task set up, you may notice the ‘Mobile App’ section at the bottom of the page:
As long as all of the criteria in the checklist are met you can enable your project for mobile. And that’s it! If your project is launch approved it will show up in the app.
Can I test the workflow before it goes live?
Yes! On the most recent release of the app we introduced a preview mode. Here’s how it works.
Prerequisites:
Project visibility set to public
Project state set to development
Project has a workflow that is mobile enabled
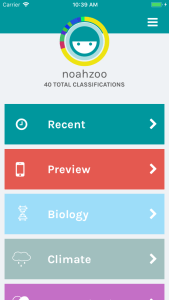
You can view this project if you log in to the app with an account that is either an owner or collaborator on the project. If everything was set up correctly, you should see a preview tab in the main menu like so:
From there you should be able to view and run your workflow just as it would appear when it is actually live.
Beta for mobile is coming
As of now, only projects that are currently launch approved can add mobile workflows. This is because we have no beta process set up for the app.
But stay tuned! We are working on a beta system for mobile. I’ll be making another blog post once that is live.
Researcher: Ellie Mackay, Mission Director & Drone Pilot
Location: London, UK
What are your main research interests?
Plastic pollution, aerial imagery and image object recognition.
Who else is in your project team? What are their roles?
Peter Kohler, Co-Founder.
Tell us more about the data used in your project
The photographs come from aerial surveys of over 40 beaches in the UK and worldwide.
How do Zooniverse volunteers contribute to your research?
They help us to train the algorithm to detect plastics automatically – this is a huge task which requires lots of photo tagging, so the volunteers help immensely with getting through all these images.
What have been the biggest challenges in setting up your project?
Financial backing/funding! We’ve had to self-fund to get the project off the ground and we’re now looking for sponsors to take the project to Phase 2.
What discoveries, and other outputs, has your project led to so far?
Extensive media coverage on multiple national and regional media channels as well as social media. Informed a secondary project on the psychological wellbeing of beach cleaning vs online volunteering.
Once you’ve finished collecting data, what research questions do you hope to be able to answer?
Where is the missing 99% of ocean plastic? Which beaches are most polluted and why? Which types of plastics wash up on different types of beaches? What are the most common types of plastic marine litter? How does plastic marine litter vary seasonally/after storms/over time/following innovations?
What’s in store for your project in the future?
Securing funding for:
Increasing the accuracy of the autonomous detection
Gathering more imagery from global contributors. -Accumulating further tagging by volunteers through Zooniverse
Creating greater public awareness through documentary, video and audio promotion
Generating engagement in citizen science through educational programmes and public engagement programmes
Creating an open source global map of plastic pollution.
What are your favourite other citizen research projects and why?
Everything on Zooniverse!
What guidance would you give to other researchers considering creating a citizen research project?
Definitely use Zooniverse if you can – it makes life a lot easier and gives you access to a whole network of dedicated and brilliant volunteers.
And finally, when not at work, where are we most likely to find you?
Travelling, diving, filming or photographing the great outdoors, Speaking at Adventure Uncovered, RGS or similar events, or at schools across the UK Promoting plastic-free living through my website and social media.
Zooniverse team members based at Chicago’s Adler Planetarium celebrated Earth Day this weekend at Earthfest, a two-day-long celebration of the planet we call home.
Visitors to the Adler Planetarium participate in a Zooniverse hands-on activity during Earthfest
In addition to many activities for all ages throughout the museum, museum visitors were able to speak with Zooniverse team members to learn about the many earth-related projects available online and on the app. Visitors could also participate in a real-life version of Floating Forests, in which they used tracing paper to illustrate areas of kelp forests on a satellite image. The activity demonstrated how Zooniverse researchers use aggregation to combine many classifications into one very accurate result. Stay tuned for the results of those tracings, coming soon!
Zooniverse team members also had some help from our friends at the Field Museum, who stopped by to talk about Microplants, a Zooniverse project studying some of the earliest land plants in the liverwort genus Frullania.
We love speaking with museum visitors and sharing the excitement of participating in real citizen science projects. If you’re in the Chicago area and missed us last weekend, keep an eye out for more information about the Adler Planetarium’s spring Members’ Night, when we’ll have even more fun Zooniverse-related activities for you!
The world's largest and most popular platform for people-powered research. This research is made possible by volunteers—millions of people around the world who come together to assist professional researchers.