Category Archives: Science

ZooTools: Going Deeper With Zooniverse Project Data

One of the best things about being an educator on the Zooniverse development team is the opportunity to interact with teachers who are using Zooniverse projects in their classroom and teachers who are interested in using Zooniverse projects in the classroom. Teachers cite several reasons about why they use these projects – Authentic data?  Check. Contributing to cutting-edge research across a variety of scientific fields?  Check.  Free?  Check. Classifying a few galaxies in Galaxy Zoo or identifying and measuring some plankton in Plankton Portal can be an exciting introduction to participating in scientific investigations with “the professionals.”  This isn’t enough though; teachers and other educators are hungry for ways to facilitate deeper student engagement with scientific data. Zooniverse educators and developers are consistently asked “How can my students dig deeper into the data on Zooniverse?”

This is where ZooTools comes into play. The Zooniverse development team has recently created ZooTools as a place where volunteers can observe, collect, and analyze data from Zooniverse citizen science projects. These tools were initially conceived as a toolkit for adult volunteers to use to make discoveries within Zooniverse data but it is becoming apparent that these would also have useful applications in formal education settings. It’s worth pointing out that these tools are currently in beta. In the world of web development beta basically means “it ain’t perfect yet.”  ZooTools is not polished and perfect; in fact it’s possible you may encounter some bugs.

Projects like Galaxy Zoo and Planet Hunters have an impressive history of “extra credit” discoveries made by volunteers.  Galaxy Zoo volunteers have made major contributions to the astronomy literature through the discovery of the green peas galaxies and Hanny’s Voorwerp .  In Planet Hunters volunteers use Talk to share methods of exploring and results from the project’s light curves.  ZooTools lowers the barrier of entry by equipping volunteers with some simple tools to look for interesting relationships and results contained within the data.  No specialist knowledge required.

We’ve only begun thinking about how ZooTools could be used in the classroom.  I started my own investigation with a question that came from a Zooniverse classroom visit from last spring.  While making observations as a class about some of the amazing animals in Snapshot Serengeti one young man asked about civets. He wanted to know If they were nocturnal. We had an interesting discussion about how you could find out this information.  The general consensus was to Google it or look it up on Wikipedia.  I wondered if you could use the data contained within Snapshot Serengeti to come up with a reasonable answer.  I was excited to roll-up my sleeves and figure out how to use these tools to find a likely answer.  Here are the steps I took…

Step 1: Log-in to Zooniverse and go to ZooTools.

Step 1

Step 2: Select a project. Currently only have a few projects have data available to explore using ZooTools.

Step 2

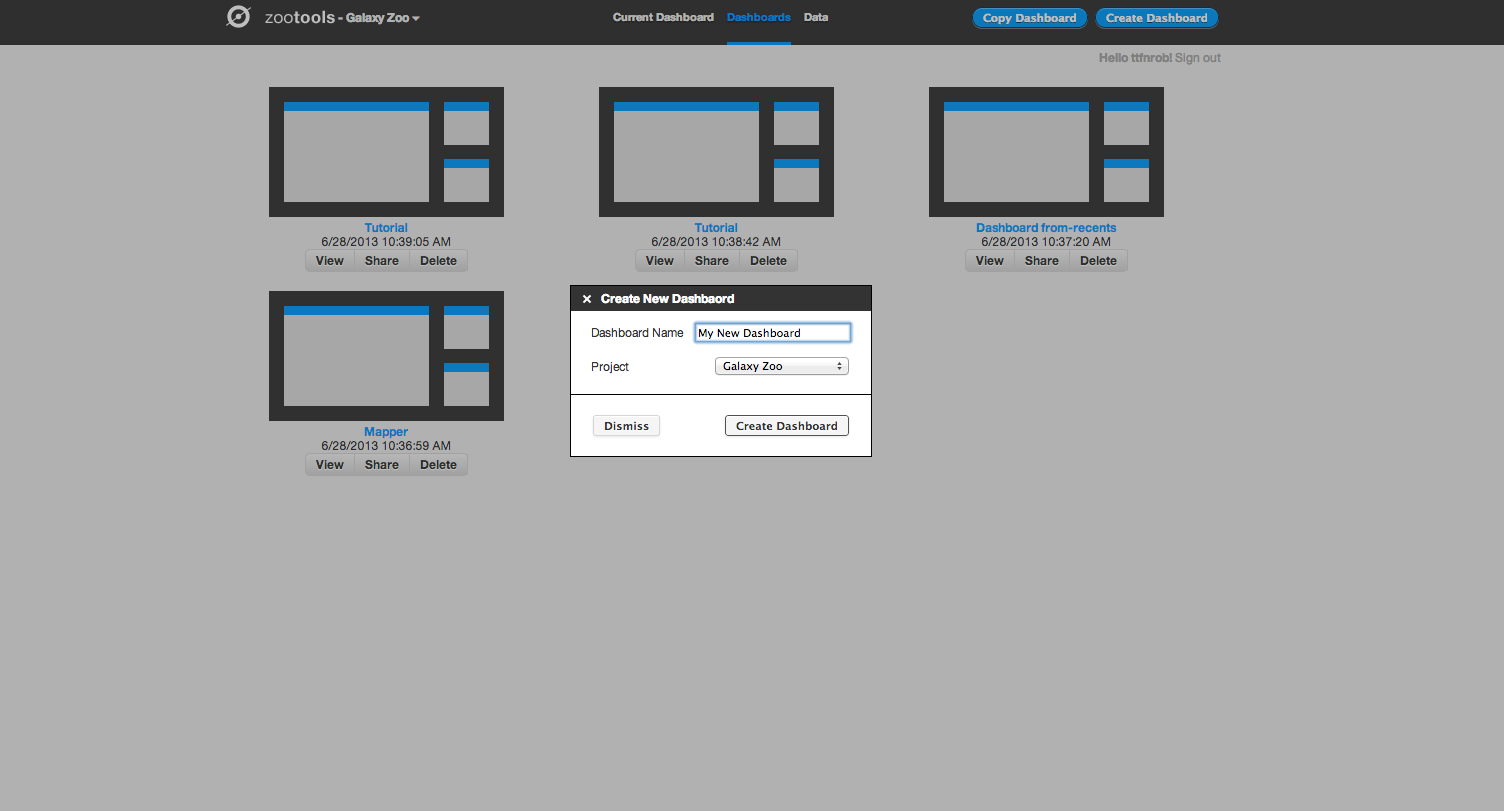
Step 3: Create a dashboard.

Step 3

Step 4: Name your dashboard something awesome. I called mine Civets! for obvious reasons.

Step 4

Step 5: This is your blank dashboard.

Step 5

Step 6: It’s time to select a data source. I selected Snapshot Serengeti.

Step 6

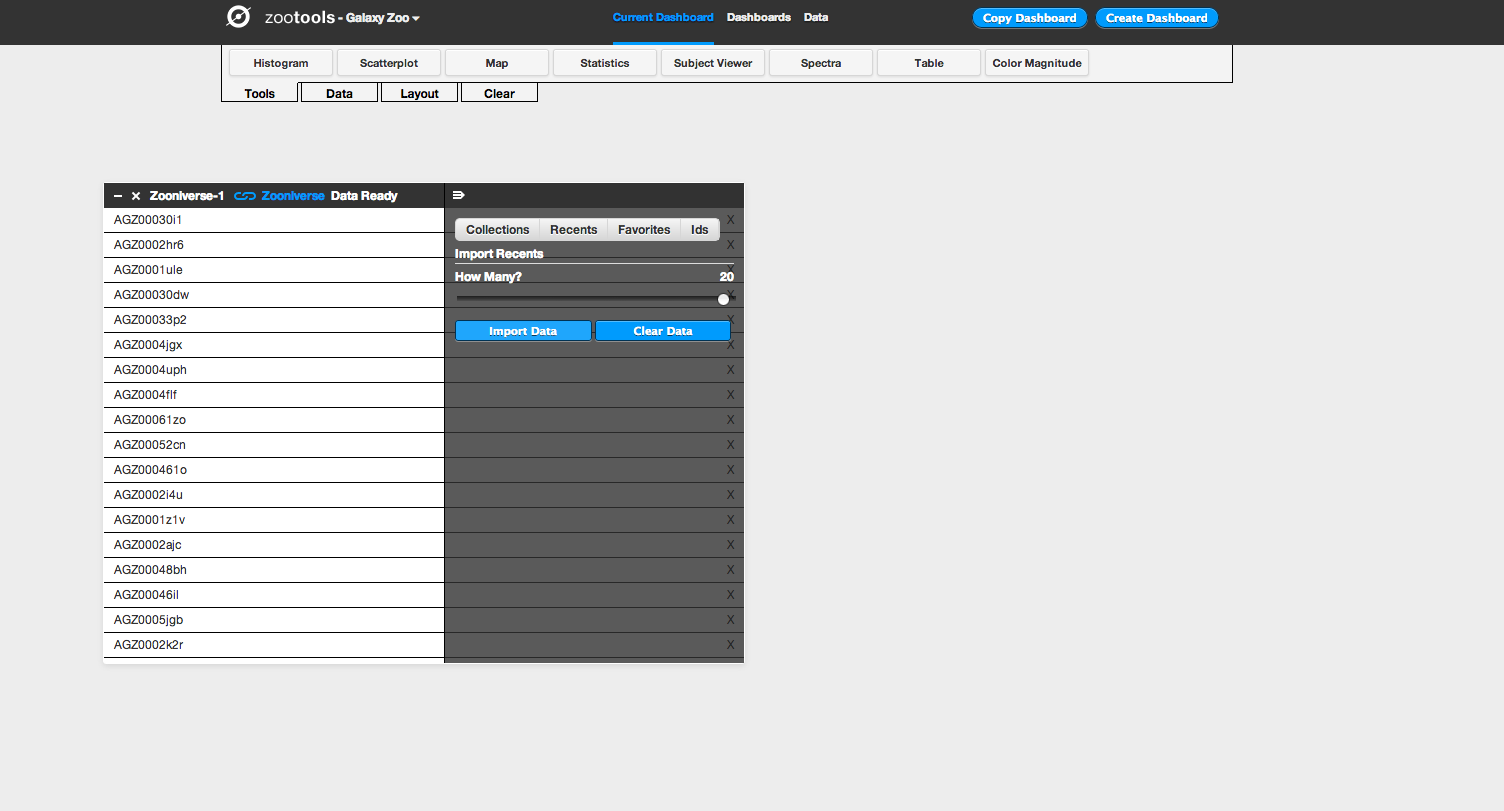
Step 7: This is the data source.

Step 7

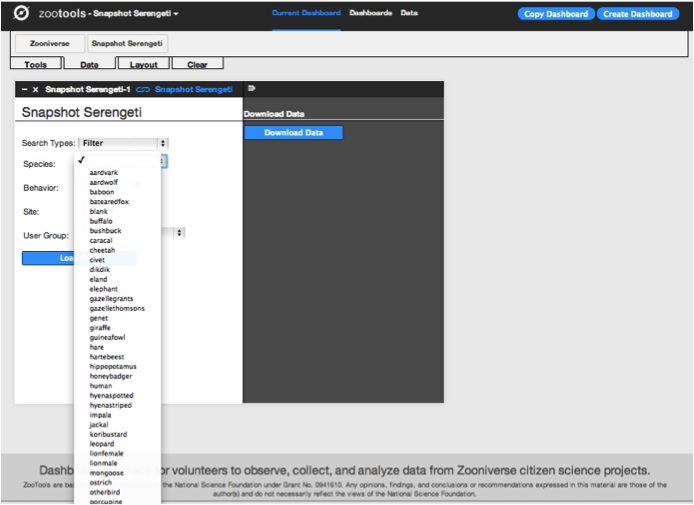
Step 8: I wanted to be able to filter my data so I selected Filter under search type. The name of this dataset in Snapshot Serengeti 1.

Step 8

Step 9: Since I wanted to look at civets, I selected that on the species dropdown menu and then clicked Load Data. My dataset will only contain images that Snapshot Serengeti volunteers identified as civets.

Step 9

Step 10: I had my data; next it was time to select a Tool.  I selected Tools at the top of the page.

Step 10

Step 11: I selected Subject Viewer because this tool allows my to flip through different images.

Step 11

Step 12: Next I had to connect my data source to my tool. From the Data Source drop down menu I selected Snapshot Serengeti 1.

Step 12

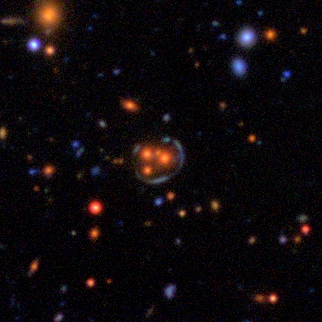
Step 13: In order to get a good luck at the images in my dataset I clicked the icon shaped like a fork to close the pane.  I then used the arrows to advance through the images.

Step 13

I flipped through the images and kept track of the night versus day. Of the 37 images in my dataset, I observed that 34 were taken at night and 3 were taken during the day.  This led me to the conclusion that civets are likely nocturnal.  This was so much more satisfying than just going to Google or Wikipedia. A couple of other questions that I explored…

What is the distribution of animals identified at one camera trap site?

14


How many honeybadgers have been observed by Snapshot Serengeti volunteers across different camera traps?

Screen Shot 2013-11-26 at 3.17.28 PM

Of course this is just the tip of the iceberg.  Currently you can explore Galaxy Zoo, Space Warps, and Snapshot Serengeti data using ZooTools. Currently you can use ZooTools to explore data from Galaxy Zoo, Space Warps, and Snapshot Serengeti.  The specific tools and datasets available vary from project to project.  In Galaxy Zoo for example you can look at data from Galaxy Zoo classifications or from SDSS Skyserver. Hopefully you’ll be inspired to have a play with these tools!  What questions would you or your students like to explore?

Our Elusive Milky Way

In the coming months the Zooniverse Education Blog will feature guest posts from participants in the Zooniverse Teacher Ambassadors Workshop. Today’s guest blogger William H. Waller is author of The Milky Way — An Insider’s Guide and co-editor of The Galactic Inquirer — an e-journal and forum on the topics of galactic and extragalactic astronomy, cosmochemistry and astrobiology, and interstellar communications.  Bill’s day job involves teaching courses in physics and astronomy at Rockport High School.

For most of human history, the night sky demanded our attention.  The shape-shifting Moon, wandering planets, pointillist stars, and occasional comet enchanted our sensibilities while inspiring diverse tales of origin.  The Milky Way, in particular, exerted a powerful presence on our distant ancestors.  Rippling across the firmament, this irregular band of ghostly light evoked myriad myths of life and death among the stars.  In 1609, Galileo Galilei pointed his telescope heavenward and discovered that the Milky Way is “nothing but a congeries of innumerable stars grouped together in clusters.”  Fast forward 400 years to the present day, and we find that the Milky Way has all but disappeared from our collective consciousness.  Where did it go?

For 25 years as an astronomy educator, I have informally polled hundreds of students, teachers, and the general public regarding their awareness of the night sky.  Invariably, no more than 25 percent have ever seen the Milky Way with their own eyes.  For city dwellers, this is completely understandable.  Unless properly shielded, the artificial lighting from municipal, commercial, and residential sources will spill into the sky and overwhelm the diffuse band of luminescence that is the hallmark of our home galaxy.  The recent video “The City Dark” produced by POV underscores the disruptive aspects that artificial lighting can produce on the life cycles of certain animals – and even upon ourselves.

View from Goodwood, Ontario before and after a power blackout (Courtesy Todd Carlson)
View from Goodwood, Ontario before and after a power blackout (Courtesy Todd Carlson

For residents of small towns well away from large cities (such as my own hometown of Rockport, MA), it is much easier to find dark “sanctuaries” where the Milky Way can be spied in all its exquisite beauty.  Yet when I poll Rockport’s sundry inhabitants about having ever seen the Milky Way, I still get a measly 25% positive response.  What’s going on here?

Is it that they don’t care about astronomy and the night sky?  I would have to say that such astronomical indifference is not typical.  Most people in conversations with me will volunteer their fascination for the planets, stars, and the exotica that our universe provides in abundance – from exoplanets to pulsars, black holes, dark matter, and dark energy.  Images from our great space telescopes have also revealed to the casual viewer many marvels of the Milky Way Galaxy, other nearby galaxies, and the remote galaxian cosmos.  Recently, stunning composite images of X-ray, visible, and infrared emission from regions of cosmic tumult have vivified the many powerful dramas that continue to unfold upon the galactic stage.

Supernova remnant Cassiopeia A, as observed 325 years after a massive star exploded.   (X-ray: blue), (Visible: green), (Infrared: red) – NASA
Supernova remnant Cassiopeia A, as observed 325 years after a massive star exploded.
(X-ray: blue), (Visible: green), (Infrared: red) – NASA

Yet, despite popular enthusiasm for the wonders of space, most people still do not bother to find a dark site and witness the source of these wonders for themselves.  Otherwise, my informal polling would have indicated that they knew about the Milky Way as a naked-eye marvel.  I suppose it comes down to the delivery of experiences.  We have grown accustomed to having our experiences conveyed to us in familiar, safe, and readily-accessible packages – be they books, magazines, television programs, planetarium shows, or interactive websites.

Regarding the latter, consider the Zooniverse online portal where anybody with an internet connection can contribute to authentic scientific research.  With just your eyes and hands, you can search for exoplanets around distant suns, trace out star-blown bubbles in our galaxy’s interstellar medium, and categorize the types of galaxies that dwell in deep space.  To date, close to a million people have contributed to  these and sundry other online scientific investigations.

Then there are the mobile apps.  One popular type of app, in particular, has brought millions more people closer to the night sky.  Google Sky Map, Droid Sky View, The Night Sky, and other interactive planetarium simulators enable a smartphone user to point the phone in any direction and see what stars and constellations are located there.  Most of these simulators show the Milky Way as a hazy band, thus cueing the viewer to its existence.  But does that mean that more people are making the effort to find dark sites for smartphone-aided star gazing?  Is participation in amateur astronomy clubs on the rise as a result?  And are star parties at our national parks surging with attendees?  My very limited research on these questions suggests that – yes – ever more people are seeking the sublime wonders of dark skies.  Whether such interactive apps are responsible for these trends remains unknown.  Still, I remain optimistic.

Perhaps our electronic addictions and virtual realities will ultimately re-introduce ourselves to the unembellished Milky Way – and to other direct experiences that Nature so generously provides.  We may be plugged-in as never before, but still we hunger for authentic interactions with the mysterious ways of Nature.  Towards these ends, I urge that we re-double our efforts to preserve the dark night sky through the advocacy of properly-shielded lighting and the establishment of dark-sky sanctuaries.  To help in these regards, please visit the International Dark Sky Society’s webpage.

Zoo Tools: A New Way to Analyze, View and Share Data

Since the very first days of Galaxy Zoo, our projects have seen amazing contributions from volunteers who have gone beyond the main classification tasks. Many of these examples have led to scientific publications, including Hanny’s Voorwerp, the ‘green pea’ galaxies, and the circumbinary planet PH1b.

One common thread that runs through the many positive experiences we’ve had with the volunteers is the way in which they’ve interacted more deeply with the data. In Galaxy Zoo, much of this has been enabled by linking to the Sloan SkyServer website, where you can find huge amounts of additional information about galaxies on the site (redshift, spectra, magnitudes, etc). We’ve put in similar links on other projects now, linking to the Kepler database on Planet Hunters, or data on the location and water conditions in Seafloor Explorer.

The second part of this that we think is really important, however, is providing ways in which users can actually use and manipulate this data. Some users have been already been very resourceful in developing their own analysis tools for Zooniverse projects, or have done lots of offline work pulling data into Excel, IDL, Python, and lots of other programs (see examples here and here). We want to make using the data easier and available to more of our community, which has led to the development of Zoo Tools (http://tools.zooniverse.org). Zoo Tools is still undergoing some development, but we’d like to start by describing what it can do and what sort of data is available.

An Example

Zoo Tools works in an environment which we call the Dashboard – each Dashboard can be thought of as a separate project that you’re working on. You can create new Dashboards yourself, or work collaboratively with other people on the same Dashboard by sharing the URL.

Zoo Tools Main Page

Create a New Dashboard

Within the Dashboard, there are two main functions: selecting/importing data, and then using tools to analyze the data.

The first step for working with the Dashboard is to select the data you’d like to analyze. At the top left of the screen, there’s a tab named “Data”. If you click on this, you’ll see the different databases that Zoo Tools can query. For Galaxy Zoo, for example, it can query the Zooniverse database itself (galaxies that are currently being classified by the project), or you can also analyze other galaxies from the SDSS via their Sky Server website.

Import Data from Zooniverse

Clicking on the “Zooniverse” button, for example, you can select galaxies in one of four ways: a Collection (either your own or someone else’s), looking at your recently classified galaxies, galaxies that you’ve favorited, or specific galaxies via their Zooniverse IDs. Selecting any of these will import them as a dataset, which you can start to look at and analyze. In this example we’ll import 20 recent galaxies.

Import 20 Recents

After importing your dataset, you can use any of the tools in Dashboard (which you can select under “Tools” at the top of the page) on your data. After selecting a tool, you choose the dataset that you’d like to work with from a dropdown menu, and then you can begin using it. For example: if I want to look at the locations of my galaxies on the sky, I can select the “Map” tool. I then select the data source I’d like to plot (in this case, “Zooniverse–1”) and the tool plots the coordinates of each galaxy on a map of the sky. I can select different wavelength options for the background (visible light, infrared, radio, etc), and could potentially use this to analyze whether my galaxies are likely to have more stars nearby based on their position with respect to the Milky Way.

The other really useful part is that the tools can talk to each other, and can pass data back and forth. For example: you could import a collection of galaxies and look at their colour in a scatterplot. You could then select only certain galaxies in that tool, and then plot the positions of those galaxies on the map. This is what we do in the screenshots below:

This slideshow requires JavaScript.

Making Data Analysis Social

You can also share Dashboards with other people. From the Zoo Tools home page you can access your existing dashboards as well as delete them and share them with others. You can share on Twitter and Facebook or just grab the URL directly. For example, the Dashboard above can be found here – with a few more tools added as a demonstration.

Sharing a Dashboard

This means that once you have a Dashboard set up and ready to use, you can send it to somebody else to use too. Doing this will mean that they see the same tools in the same configuration, but on their own account. They can then either replicate or verify your work – or branch off and use what you were doing as a springboard for something new.

What ‘Tools’ Are There?

Currently, there are eight tools available for both regular Galaxy Zoo and the Galaxy Zoo Quench projects:

  • Histogram: makes bar charts of a single data parameter
  • Scatterplot: plot any two data parameters against each other
  • Map: plot the position of objects on the sky, overplotted on maps of the sky at different wavelengths (radio, visible, X-ray, etc.)
  • Statistics: compute some of the most common statistics on your data (eg, mean, minimum, maximum, etc).
  • Subject viewer: examine individual objects, including both the image and all the metadata associated with that object
  • Spectra: for galaxies in the SDSS with a spectrum, download and examine the spectrum.
  • Table: List the metadata for all objects in a dataset. You can also use this tool to create new columns from the data that exists – for example, take the difference between magnitudes to define the color of a galaxy.
  • Color-magnitude: look at how the color and magnitude of galaxies compare to the total population of Galaxy Zoo. A really nice way of visualizing and analyzing how unusual a particular galaxy might be.

We have one tool up and running for Space Warps called Space Warp Viewer. This lets users adjust the color and scale parameters of image to examine potential gravitational lenses in more detail.

Snapshot Serengeti Dashboard

Finally, Snapshot Serengeti has several of the same tools that Galaxy Zoo does, including Statistics, Subject Viewer, Table, and Histogram (aka Bar Graph). There’s also Image Gallery, where you can examine the still images from your datasets, and we’re working on an Image Player. There’s a few very cool and advanced tools we started developing last week – they’re not yet deployed, but we’re really excited to let you follow the activity over many seasons or by focusing on particular cameras. Stay tuned. You can see an example Serengeti Dashboard, showing the distribution of Cheetahs, here (it’s also shown in the screenshot above).

We hope that Zoo Tools will be an important part of all Zooniverse projects in the future, and we’re looking forward to you trying them out. More to come soon!

Galaxy Zoo Quench: A New Kind of Citizen Science

A new ‘mini’ project went live yesterday called Galaxy Zoo Quench. This project involves new images of 6,004 galaxies drawn from the original Galaxy Zoo. As usual, everyone is invited to come and classify these galaxies, but this project has a twist that makes it special! We hope to take citizen science to the next level by providing the opportunity to take part in the entire scientific process – everything from classifying galaxies to analyzing results to collaborating with astronomers to writing a scientific article!

Galaxy Zoo Quench

Galaxy Zoo Quench is examining a sample of galaxies that have recently and abruptly quenched their star formation. These galaxies are aptly named Post-Quenched Galaxies. They provide an ideal laboratory for studying galaxy evolution. So that’s exactly what we want to do: with the help of the Zooniverse community. We hope you’ll join us as we try out a new kind of citizen science project. Visit http://quench.galaxyzoo.org to learn more.

The entire process of classifying, analyzing, discussing, and writing the article will take place over an ~8-12 week period. After classifying the galaxies, Quench volunteers can use tools.zooniverse.org to plot the data and look for trends. We also have a special Quench Talk forum to discuss and identify key results to include in the paper – above you can see examples of some of the cool objects people have already found and discussed.

Have questions about the project? Leave a comment here or ask us on Twitter (@galaxyzoo) or on the Galaxy Zoo Facebook page. In case you’re worried: the regular Galaxy Zoo will continue as normal.

Now go visit http://quench.galaxyzoo.org and start classifying!

New Project: Join the Search for ‘Space Warps’

Gravitational lenses – or ‘space warps’ – are created when massive galaxies cause light to bend around them such that they act rather like giant lenses in space. By looking through data that has never been seen by human eyes, our new Space Warps project is asking citizen scientists to help discover some of these incredibly rare objects. We need your help to spot these chance-alignments of galaxies in a huge survey of the night sky. To take part visit www.spacewarps.org.

A Gravitational Lens

Gravitational lenses help us to answer all kinds of questions about galaxies, including how many very low mass stars such as brown dwarfs – which aren’t bright enough to detect directly in many observations – are lurking in distant galaxies. The Zooniverse has always been about connecting people with the biggest questions and now, with Space Warps, we’re taking our first trip to the early Universe. We’re excited to let people be the first to see some of the rarest astronomical objects of all!

The Space Warps project is a lens discovery engine. Joining the search is easy: when you visit the website you are given examples of what space warps look like and are shown how to mark potential candidates on each image. The first set of images to be inspected in this project is from the CFHT (Canada-France-Hawaii Telescope) legacy survey.

Computer algorithms have already scanned the images, but there are likely to be many more space warps that the algorithms have missed. We think that only with human help will we find them all. Realistic simulated lenses are dropped into some images to help you learn how to spot them, and reassure you that you’re on the right track. Previous studies have shown that the human brain is better at identifying complex lenses than computers are, and we know at the Zooniverse that members of the public can be at least as good at spotting astronomical objects as experts! We’re going to use the data from citizen scientists to continuously train computers to become better space warp spotters.

This is a really exciting project and you can read more on the Space Warps blog. As with our other projects it can also be found on Twitter (@SpaceWarps), on Facebook and you can discuss any interesting objects you find on Space Warps Talk. We’re really excited about this project and think you’ll be able to make some amazing discoveries through it.

New Publications Page

Zoo Avatars

This year has been a very productive one for the Zooniverse. Planet Hunters, Galaxy Zoo, the Milky Way Project, Ice Hunters, Whale FM Solar Stormwatch and Galaxy Zoo: Supernovae all released peer-reviewed papers, producing science results based on your clicks. We also released a slew of new projects (with more to come!) and all of this is about doing science in a new way: with your help.

We’re kicking off our 2012 Zooniverse Advent Calendar with the release of our new publications page which lets you find these papers, and all the papers from all Zooniverse projects. We aim to have many more projects published by this time next year.

However you celebrate the festive season – or whether you do it at all at this time of year – we hope you’ll enjoy opening each day of our advent calendar between now and Dec 24th. We have some fun items ready to show you, and a few really big announcements too.

A very good day in Austin

Every January, a travelling circus of astronomers and their friends rolls into an American city. This travelling carnival, the winter meeting of the American Astronomical Society, brings together literally thousands of people, ostensibly to give talks about cutting edge research, but more importantly to meet, greet, gossip and collaborate.

Photo by Sarah Kendrew released under CC-by-nc-sa/2.0/

Eli Bressert (Milky Way Project) & Kevin Schawinski (Galaxy Zoo)

This year’s festivities started in Austin, Texas over the weekend, and amongst the gathered throng are many of the Zooniverse astronomers, who contributed to a Monday that demonstrated the wonderful use to which the hard work of registered volunteers is being put.

I missed some of the morning sessions, but was in the main conference hall to hear Bob Benjamin plug the first Milky Way Project paper, soon (we hope) to be accepted following a very positive referee’s report. The more than 5000 bubbles discovered by MWP project participants will, he said, help us map the nearby galaxy.

This high-profile support followed a talk given over the weekend by MWP science team member Matt Povich to a smaller gathering of early-career researchers who are funded as National Science Foundations fellows. Also presenting was Planet Hunters’ very own Meg Schwamb, and after lunch it was my turn to present Zooniverse results, announcing the discovery of two new planet candidates by volunteers. Particularly pleasing here was the involvement of the Talk tool, specifically developed to make it easier for the science team to follow up on interesting discoveries.

Last time the astronomers of America gathered in Austin, we were less than a year into Galaxy Zoo, and the highlight was the arrival during the meeting of the first high-resolution spectrum of Galaxy Zoo’s famous Voorwerp. It was therefore particularly pleasing when Kevin Schawinski nudged me in an early talk, pointing out the appearance on Chandra’s schedule of observations include observations of the Voorwerp’s neighbouring galaxy, IC2497.

Those observations arrived on Monday afternoon and Bill Keel, Kevin and I had a happy few minutes pouring over them (we only had a quick look image, so there’s a limit to what we can say!). There’s lots of work to be done before we can draw too many conclusions, but we’d struggled to win Chandra time, so it’s wonderful to see data flowing. Just down the corridor, Sarah Kendrew from MWP was talking to Ramin Skibba from Galaxy Zoo about techniques for matching different clases of objects.

After the plenaries, Kevin, Bill and I joined a dozen or so members of the Galaxy Zoo team, who are presenting five times over the next few days, making sure that we’re making the most of Galaxy Zoo results. The discussion was about the next iteration and iterations of the GZ site, but that’s a story for another time.

A few hours, and a few different sessions, and Zooniverse science had been highlighted in several different ways. There’s no doubt that the kind of ‘citizen science’ projects at which the Zooniverse excels are becoming more popular, and you’ll see more of them both from the Zooniverse and elsewhere over the next few months. The acid test, though, remains whether a project can actually produce science, an outcome that’s the result of careful design, smooth implementation but also of commitment and hard work from scientists like those on the Milky Way Project, Planet Hunters and Galaxy Zoo teams. Without those things, it’s incredibly easy to waste a large amount of volunteers’ time, breaking the implicit contract that exists between project team and volunteer when we ask for your help.

Of the eight Zooniverse projects that were live at the beginning of 2011, six (the three already mentioned along with Solar Stormwatch and Galaxy Zoo : Supernovae which have papers, and Old Weather has contributed data to its climate scientists) have serious published results. Of the other two, we now have funding for a three year Moon Zoo postdoc in London to make use of the data that’s been collected, and I have a meeting tomorrow to look at the results from 5 million simulations in the mergers project. It’s a track record that everyone involved with the Zooniverse can be very proud of, a challenge to anyone thinking of launching their own projects, and it’s certainly getting us notice amidst the chaos and clamour of AAS. Thanks a million for making it happen, click, by click, by click.

Chris