
Science Scribbler: Key2Cat Update from Nanoparticle Picking Workflow
Hi!
This is the Science Scribbler Team with some exciting news from our latest project: Key2Cat! We have been blown away by the incredible support of this community – hundreds of you have taken part in the Key2Cat project (https://www.zooniverse.org/projects/msbrhonclif/science-scribbler-key2cat) and helped to pick nanoparticles in our electron microscopy images of catalyst nanoparticles. In just 1 week, over 50,000 classifications were completed on 10,000 subjects and 170,000 nanoparticles and clusters were found!
Thank you for this huge effort!
We went through the data and prepared everything for the next step: classification. Getting the central coordinates of our nanoparticles and clusters with the correct class will allow us to improve our deep learning approach. But before getting into the details of the next steps, let’s recap what has been done so far using the gold on germanium (Au/Ge) data as an example.
PICKING CATALYST PARTICLES
In the first workflow, you were asked to pick out both nanoparticles and clusters using a marking tool, which looked something like this:
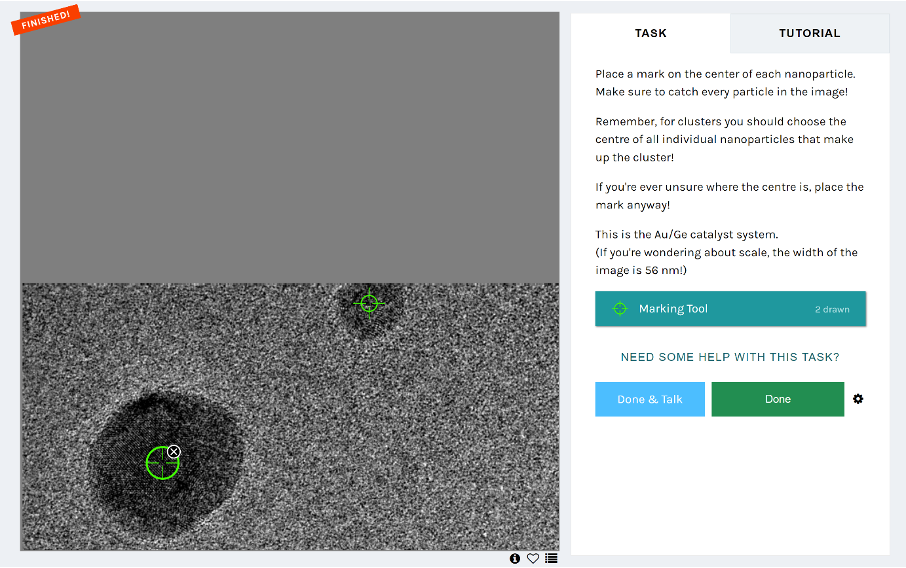
As you might have realized, each of the images was only a small piece of a whole image. We tiled the images so that they wouldn’t be so overwhelming and time-consuming for an individual volunteer to work with. We also built in some overlap between the tiles so that if a nanoparticle fell on the edge in one image, it would be in the centre in another. Each tile was then shown to 5 different volunteers so that we could form a consensus on the centres of nanoparticles and clusters.
CRUNCHING THROUGH THE DATA
With your enormous speed, the whole Au/Ge dataset (94 full size images) was classified in just a few days! We have collected all of your marks and sorted them into their corresponding tiles. If we consider just a single tile that has been looked at by 5 volunteers, this is what the output data looks like:

With some thinking and coding we can recombine all the tiles that make up a single image, including the marks placed by all volunteers that contributed to the image:

Wow, you all are really good at picking out the catalyst particles! Seeing how precisely all centres have been picked out in this visualisation is quite impressive. You may notice that there are more than 5 marks per nanoparticle – this is because of the overlap that we mentioned earlier. When taking the overlap into consideration, this means that each nanoparticle should be seen (at least partially!) by 20 volunteers.
The next step is to combine all of the marks to find a consensus centre point for each nanoparticle so that we have one set of coordinates to work with. There are numerous ways of doing this. One of the first that has given us good results is an unsupervised k-means algorithm [1]. This algorithm looks at all of the marks on the image and tries to find clusters of marks that are close to each other. It then joins these marks up into a single mark by finding a weighted average of their placements. You can think of it like tug-of-war where the algorithm finds the centre point because more marks are pulling it there.

As you can see, the consensus based on your marks almost perfectly points at the centres of individual nanoparticles or nanoparticle clusters. We don’t yet know from this analysis if the nanoparticle is a part of a cluster or not, and in some cases, we also get marks in areas which are not nanoparticles as shown in the orange and red boxes above. Since only small parts of the overall image were shown in the marking task, the artifact in the orange box was mistaken as a nanoparticle and in the case of the red box, there is a mark at the very edge and on a very small dot-like instance where some of you might have been suspicious about another nanoparticle. This is expected, especially since we asked volunteers to place marks if they were unsure – we wanted to capture all possible instances of nanoparticles in this first step!
REFINING THE DATA
This is the part where the second workflow comes into play. Using the marks from the first workflow, we createda new dataset showing just a small area around the mark to collect more information.In this workflow we ask a few questions to help identify exactly what we see at each of the marks

With this workflow, we hope to classify all the nanoparticles and clusters of both the Au/Ge and Pd/C catalyst systems, while potential false marks can be cleaned up! Once this is accomplished, we’ll have all the required inputs to improve our deep learning approach.
We’re currently collecting classifications on the Au/Ge data and will soon switch over to the Pd/C data, so if you have a few spare minutes, we would be very happy if you left some classifications in our project! https://www.zooniverse.org/projects/msbrhonclif/science-scribbler-key2cat/classify
-Kevin & Michele
Got your interest? Do you have questions? Get in touch!
Talk: https://www.zooniverse.org/projects/msbrhonclif/science-scribbler-key2cat/talk
References:
[1]: M. Ahmed, R. Seraj, S. M. S. Islam, Electronics (2020), 9 (8), 1295.
