
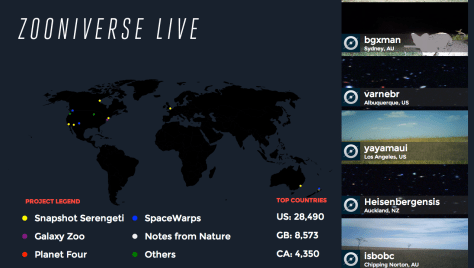
Yesterday we pushed Zooniverse Live to be… er… live. Zooniverse Live is a constantly updated screen, showing live updates from most of our projects. You’ll see a map displaying the location of recent Zooniverse volunteer’s classifications and a fast-moving list of recently classified images. Zooniverse Live is on display in our Chicago and Oxford offices, but we thought it would be cool to share it with everyone.
The Zooniverse is a very busy place these days and we’ve been looking for ways to visualize activity across all the projects. Zooniverse Live is a fairly simple web application. Its backend is written in Clojure (pronounced Closure) and the front end is written in JavaScript using a library for data visualization called D3. The Zooniverse Live server listens to a stream of classification information provided by the Zooniverse projects – via a database technology called Redis. Zooniverse Live then updates its own internal database of classifications on the backend, with the front end periodically asking for updates.
The secret sauce is figuring out where users are classifying from. Zooniverse Live does that using IP Addresses. Everyone connected to the internet is assigned an IP Address by their Internet Service Provider (ISP). While the IP address assigned may change each time a computer connects to the internet, each address is unique and can be tied to a rough geographical area. When Zooniverse projects send their classifications to Zooniverse Live, they include the IP Address the user was classifying from, letting Zooniverse Live do a lookup for the user’s location to plot on the map. The locations obtained in this way are approximate, and in most cases represent your local Internet exchange.
Hopefully you’ll enjoy having a look at Zooniverse Live, and we’d love to hear ideas for other Zooniverse data visualizations you’d like to see.

Something seems strange about Zooniverse Live. When I look at it, I get the same 4 people/locations constantly and the same ~12 objects scrolling on the right. Even when I refresh (and restart), the same ones are there. I tried doing a few Snapshot Serengeti classifications and a Notes from Nature one, but my classifications were not incorporated into the stream, and my location was never shown…
Yup I filled up the database we were using to store classifications. I think it should be fixed now.
Looks good now. Now it seems to think I’m in Arizona! Definitely way too humid here for that to be true… (wonder why my IP comes through like that…)
I’m getting the same behavior as Margaret, although I saw my GZ classifications pop up instantly when I tried this yesterday. Caching problem of some kind?
Make that three, but, unlike Kyle, I did not see my GZ classifications pop up.
Z:L tracks only classifications, right? Posts in any of the associated Talks, or fora (such as the GZ forum); comments and blog posts; etc do not register in Z:L, right?
Concerning different visualization ideas: what about geographical usage heatmaps for projects? Or a correlation heatmap detailing which projects are comonly used by the same zooites?
Oddly, I actually have a heat map of common projects already. I’ll try and post it soon 🙂
Hey, other users are having serious non-working issues with Zooniverse Live. See here: https://www.facebook.com/SnapshotSerengeti/posts/403368669764211?comment_id=2000748&offset=0&total_comments=5¬if_t=share_comment
I am not surprised there are non-working issues with its use. It uses over 1Gb physical memory and high cpu useage and bandwidth continually. It must choke up general web useage. It would be a good idea to discontinue it.
I’m sorry to hear you’re having trouble. Zooniverse Live is a bit experimental and might not suit all browsers. That said it doesn’t hog too much bandwidth, although you’re right that (on older machines) it may take up a lot of memory. When we have time, we’ll improve it as we do with all our sites.
I think discontinuing it would be going a bit far, it is proudly displayed in the Zooniverse offices as it’s a great to show how much hard work the community is always doing 🙂
Sorry, but using the current version of Zooniverse Live doesn’t interest me.
I think, that the displayed information are rather uninteresting. Anyway.
Actually, it is questionable to display publicly the IP-locations of volunteers together with their usernames. I would say, that someone’s IP- location is private information and I doubt, that it is okay according to your Privacy Policy to display it publicy together with a username, without having particularly the user’s permission!
So I ask the Zooniverse Team to review their decision, that IP-locations together with usernames are now available in public! Asking for comments by the Zooniverse Team!
PS: I wonder, if there are any other webpages, which also display IP-locations together with usernames in public?
The locations displayed on the map are not very precise and certainly couldn’t be used to determine a person’s address. They just show the latitude and longitude of a person’s IP address, which is based on the approximate coordinates of the city that they are accessing the Internet from. I hope that helps explain what you’re seeing on the map and why we don’t think it infringes anyone’s privacy.
Sorry, but your reply doesn’t help. I think, that someone else should judge this matter. I suggest, that you ask the University’s Data Protection Officer, if it is really okay to display IP-locations together with usernames publicly! (I would be rather astonished, if s/he agreed with the Zooniverse Team.)
In addition to the comment, which I did today.:
I don’t understand, why you refer just to the map in your reply.
On the screenshot there are displayed towns, e.g. “Albuquerque, US”, together with usernames. On the screenshot there are shown nicknames, but there are users, who use their real names. When someone uses her/his real name, it is even worse, when his/her IP-location is displayed.
I think, that even displaying just a nickname together with the country, means infringing a user’s privacy. The user has even no option to disagree, that his/her IP-location is displayed.
You display IP-locations together with usernames just for fun and I think, that it is inappropiate to infringe the users’ privacy just for fun. (Well, you think, that you don’t do, but you might be wrong.)
PS: I wonder, how many users actually used “Zooniverse Live” so far? / How often was it used by the users so far?
I noticed, that the usernames are no longer displayed.
Just a little question : what do the numbers of the Top Countries stand for ?
This is number of classifications I suppose. Every time when you classify piece of data server recognizes IP of your computer.
Yes,but is it the grand total since the beginning or number of classifications this year or what ? 😀
Forgive me Elisabeth. I was not sure if that is you 😉
Lets wait for confirmation, but since original question was asked over moth ago it might take a while. In mean time I have added all counts together and it totals to 5’184’950. Assuming people classify approx. 60-90 images per minute, which is what I see on live.zoonivere.org most of the time, it took 10 years to classify. This approximation is obviously wrong, but grand total looks reasonable. Live long and prosper! 😉
I just have read latest post about ILFS impact on The Andromeda Project and I think my assumptions were wrong 😉 Grand total, since beginning of Zooniverse, should be at least 10x bigger I think. Andromeda has almost 1.5mln classifications alone! It seems that numbers presented in live.zooniverse.org represent classifications since release of live only.
Folks, dammit, tell us the truth! ;-D
I would be interested in knowing how many active user accounts are registered. I can see that 878k “people taking part worldwide”, but how many accounts are still active? What is distribution? Etc.
Do you plan to release some data? Is it accessible somewhere? 😉